I haven’t done a Friday Chart in a while, but this struck me: This is a chart showing the inventory for Scripps Ranch in San Diego, courtesy of one of the best writers I know,…
Browsing Category Friday
Question Everything – Especially Real Estate Reporting (Friday Chart)
All of the MLS (about 30+ counties)? – In Charlottesville/Albemarle in February 2011, 66 homes sold. – In Charlottesville, Albemarle, Fluvanna, Greene, Nelson, 106 homes sold. – In Charlottesville, Albemarle, Fluvanna, Greene, Nelson, Louisa, 133 homes sold and 172 went under contract. – In the entire MLS , (which is mostly irrelevant to my readers) 455 homes sold. For a better representation of real estate data that is relevant to real estate buyers, sellers, voyeurs, consumers in the Charlottesville MSA: 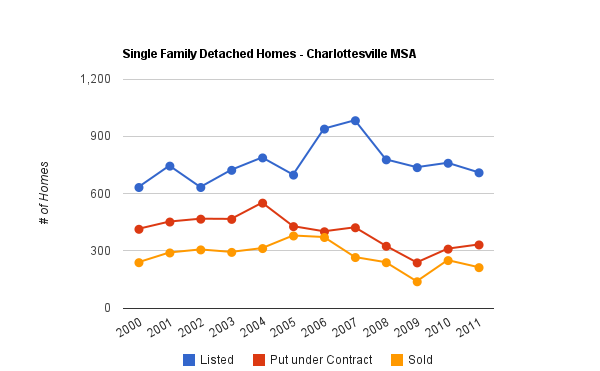 Same information, different display:
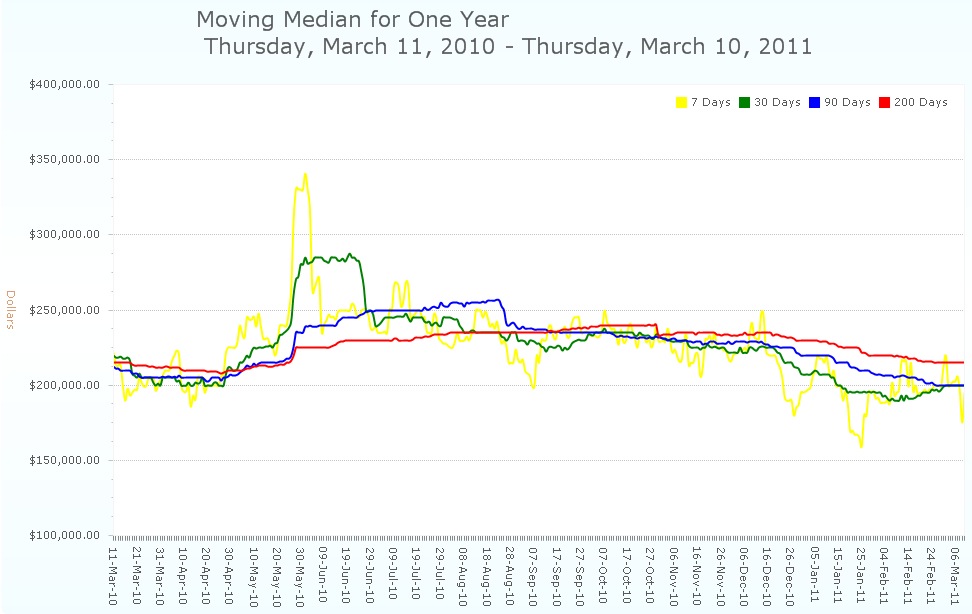
 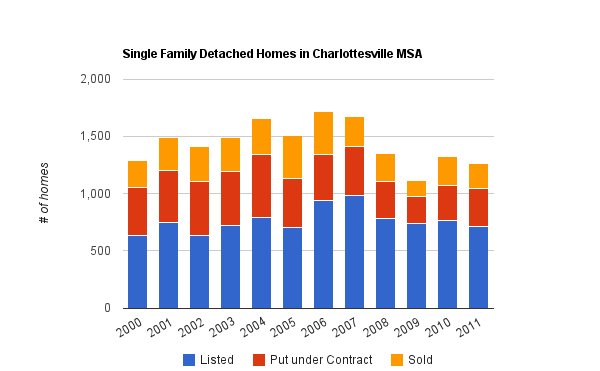 (I like this one as it gives a good understanding of the total volume we’re dealing with) As always, raw data is at the bottom of this post. … For the sake of accuracy, I typically discount/ignore aggregate days on market; they are so easily manipulated (such as by those entering new construction with 0 days on market to make their numbers look better, realtors gaming the mls , etc) – Even More about Days on Market – Days on Market Matter in Charlottesville – For consistency, I am excluding Louisa County. … Looking at this broad of a dataset is not useful when considering what your home may be worth.
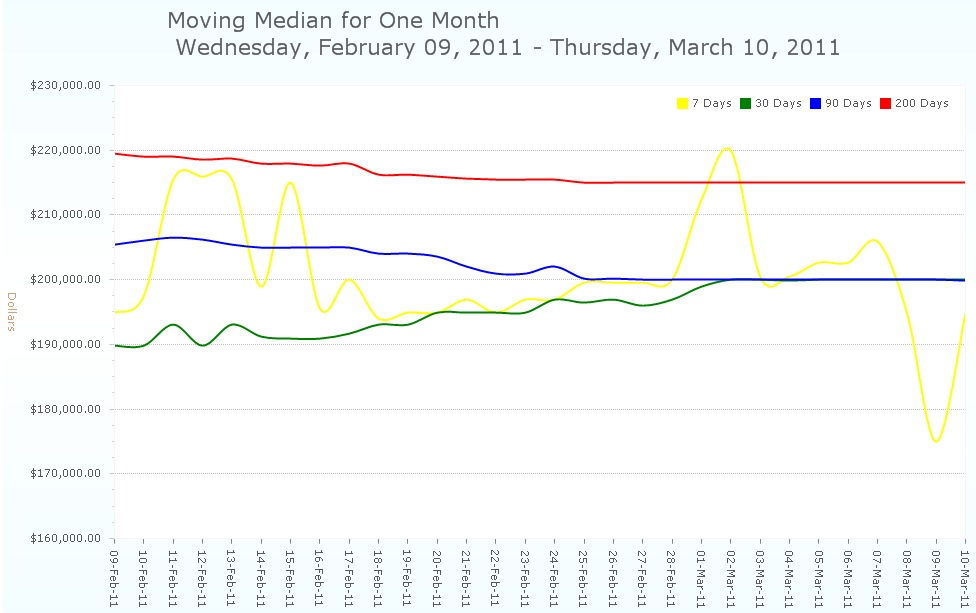
 Raw data, inclusive of inadequate short sales and foreclosures: .
Friday Chart – Charlottesville MSA Real Estate Update – First 47 Days
I'm always trying to get a handle on what's happening in the Charlottesville real estate market**, and while anecdotal evidence is useful, data is mighty helpful as well.
… Today we're looking for trends; as I've said for years, looking at data from any level other than this house (whatever that house is) can be misleading.
…key=0AsdZ2NoUfJTrdGRFQUxzbUJfYmNjc2FVbENkbnhsOVE&range=A1%3AM4&gid=8&transpose=1&headers=1&pub=1″,”options”:{“displayAnnotations”:true,”showTip”:true,”nonGeoMapColors”:[“#0000ff”,”#DC3912″,”#FF9900″,”#109618″,”#990099″,”#0099C6″,”#DD4477″,”#66AA00″,”#B82E2E”,”#316395″],”reverseCategories”:false,”titleY”:”Volume “,”dataMode”:”markers”,”maxAlternation”:1,”pointSize”:”0″,”colors”:[“#0000ff”,”#DC3912″,”#FF9900″,”#109618″,”#990099″,”#0099C6″,”#DD4477″,”#66AA00″,”#B82E2E”,”#316395″],”smoothLine”:false,”lineWidth”:”2″,”labelPosition”:”right”,”is3D”:false,”logScale”:false,”hasLabelsColumn”:true,”wmode”:”opaque”,”title”:”Single Family Homes in Charlottesville MSA – Listed, Contract, Sold”,”legend”:”bottom”,”allowCollapse”:true,”reverseAxis”:false,”isStacked”:true,”mapType”:”hybrid”,”width”:700,”height”:393},”refreshInterval”:5}
… Every time I see just how dead 2009 was, I'm a little surprised, and thankful to have made it through that time period.
Friday Chart – Where are We *Right Now*?
For your review: The Nest Report for January 2011 (pdf) covering the Charlottesville Extended MSA (EMSA)* 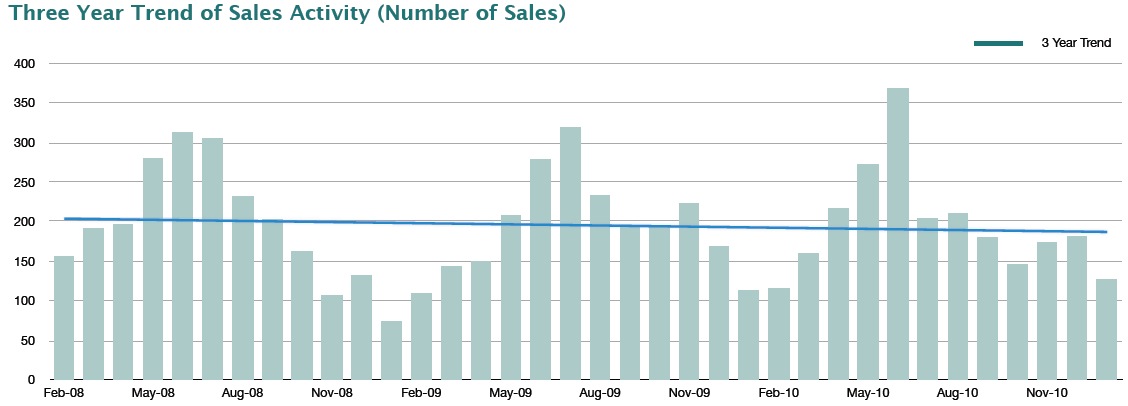 * EMSA = Charlottesville, Albemarle, Nelson, Louisa, Greene, Fluvanna
Friday Chart – Contracts in January
I’ll let you know in 18 months. Looking at all residential properties in the Charlottesville MSA put under contract in the first 27 days of the year over the past ten years …
…Or maybe it’s just an interesting Friday Chart . 99 single family homes + 25 attached homes + 17 condos = 141 properties put under contract in the first 27 days of January.
…Housing sales are at an all-time low (nationally) … make sure to educate yourself about the Charlottesville area market as well. … You need to align yourself with an advisor who has your best interests in mind, one who takes a realistic approach, one who is not afraid to tell you to rent, one who analyzed the market consistently.
When Do Homes Come on the Market in Charlottesville?
“When Do Homes Come on the Market in Charlottesville?” is one of the most common questions I get.
Using the data from 2010 for the Charlottesville MSA*, it’s clear that homes come on the market in the early part of the year.
When Do Houses Come on the Market in Charlottesville?
When do houses come on the market in Charlottesville?
… When should I put it back on the market?
… The number of homes* listed and put under contract in the Charlottesville MSA* from February through October :
… Here we look at the number of Homes** in Charlottesville MSA Listed & Under contract from November through January :