I’d say this is a bit more in-depth and in line with my readers’ expectations. Download the PDF: Nest Realty Group’s 1st Quarter 2011 Market Report
Posts tagged Market
Question Everything – Especially Real Estate Reporting (Friday Chart)
All of the MLS (about 30+ counties)? – In Charlottesville/Albemarle in February 2011, 66 homes sold. – In Charlottesville, Albemarle, Fluvanna, Greene, Nelson, 106 homes sold. – In Charlottesville, Albemarle, Fluvanna, Greene, Nelson, Louisa, 133 homes sold and 172 went under contract. – In the entire MLS , (which is mostly irrelevant to my readers) 455 homes sold. For a better representation of real estate data that is relevant to real estate buyers, sellers, voyeurs, consumers in the Charlottesville MSA: 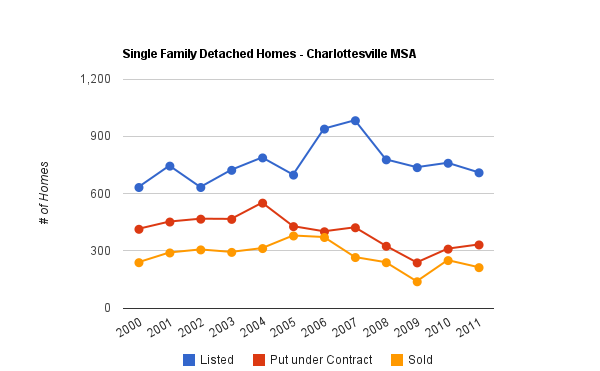 Same information, different display:
 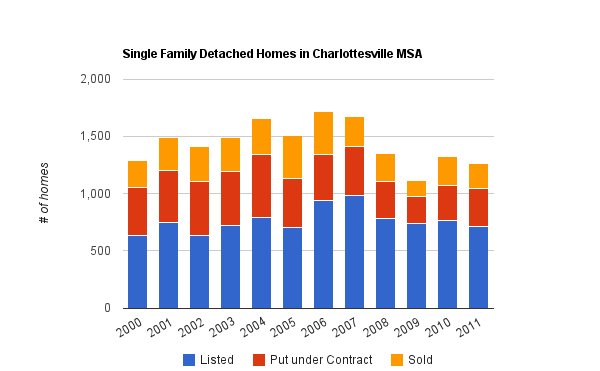 (I like this one as it gives a good understanding of the total volume we’re dealing with) As always, raw data is at the bottom of this post. … For the sake of accuracy, I typically discount/ignore aggregate days on market; they are so easily manipulated (such as by those entering new construction with 0 days on market to make their numbers look better, realtors gaming the mls , etc) – Even More about Days on Market – Days on Market Matter in Charlottesville – For consistency, I am excluding Louisa County. … Looking at this broad of a dataset is not useful when considering what your home may be worth.
 Raw data, inclusive of inadequate short sales and foreclosures: .
Friday Chart – Charlottesville MSA Real Estate Update – First 47 Days
I'm always trying to get a handle on what's happening in the Charlottesville real estate market**, and while anecdotal evidence is useful, data is mighty helpful as well.
… Today we're looking for trends; as I've said for years, looking at data from any level other than this house (whatever that house is) can be misleading.
…key=0AsdZ2NoUfJTrdGRFQUxzbUJfYmNjc2FVbENkbnhsOVE&range=A1%3AM4&gid=8&transpose=1&headers=1&pub=1″,”options”:{“displayAnnotations”:true,”showTip”:true,”nonGeoMapColors”:[“#0000ff”,”#DC3912″,”#FF9900″,”#109618″,”#990099″,”#0099C6″,”#DD4477″,”#66AA00″,”#B82E2E”,”#316395″],”reverseCategories”:false,”titleY”:”Volume “,”dataMode”:”markers”,”maxAlternation”:1,”pointSize”:”0″,”colors”:[“#0000ff”,”#DC3912″,”#FF9900″,”#109618″,”#990099″,”#0099C6″,”#DD4477″,”#66AA00″,”#B82E2E”,”#316395″],”smoothLine”:false,”lineWidth”:”2″,”labelPosition”:”right”,”is3D”:false,”logScale”:false,”hasLabelsColumn”:true,”wmode”:”opaque”,”title”:”Single Family Homes in Charlottesville MSA – Listed, Contract, Sold”,”legend”:”bottom”,”allowCollapse”:true,”reverseAxis”:false,”isStacked”:true,”mapType”:”hybrid”,”width”:700,”height”:393},”refreshInterval”:5}
… Every time I see just how dead 2009 was, I'm a little surprised, and thankful to have made it through that time period.
The Nest Report – Charlottesville Real Estate Market update
Please read, digest, ask questions. Download it here or read it below the fold.
Charlottesville real estate market report
Charlottesville Real Estate Market Update – October 2010
October 2010 marked the 4th straight month that our sales in the Charlottesville MSA were  down.  The 9 straight months of month-over-month sales increases is in danger of being completely wiped out.  And sales in Oct 10 weren’t a little off as compared to Oct 09, they were WAY off.  … After 2 straight months of being just a few sales short, October proved to be the second worst month in the last year (July sales were off a whopping 36%).
Home Sales Trends in Virginia – From Virginia Association of Realtors
Albemarle, Augusta, Bath, Buena Vista City, Charlottesville City, Fluvanna, Greene, Harrisonburg City, Highland, Lexington City, Nelson, Rockbridge, Rockingham,Staunton City,Waynesboro City
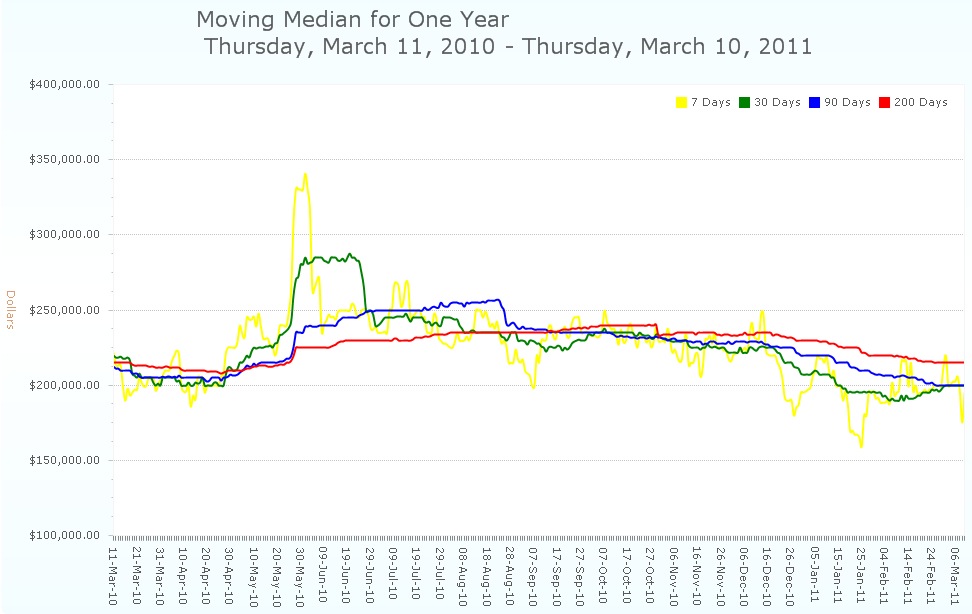
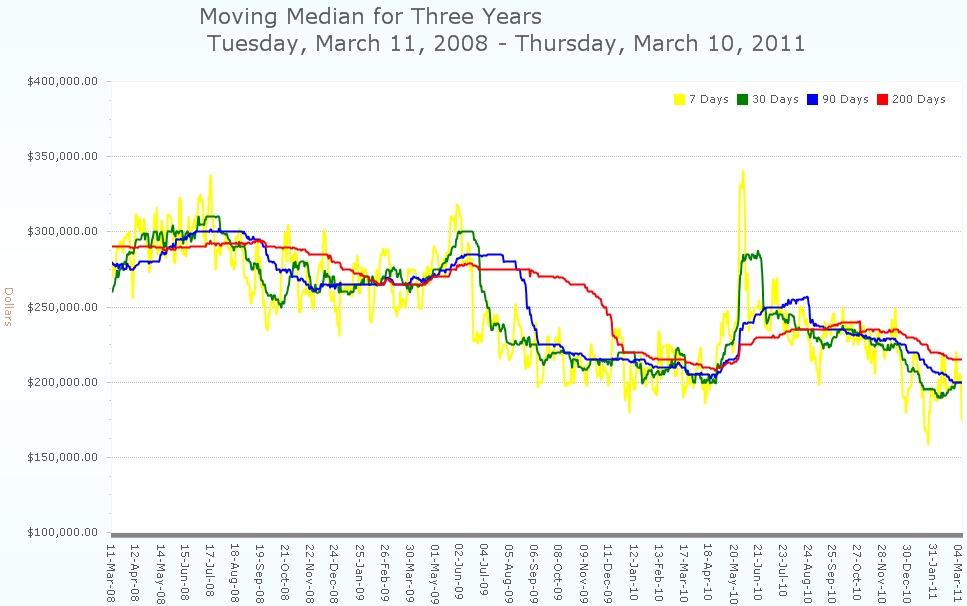
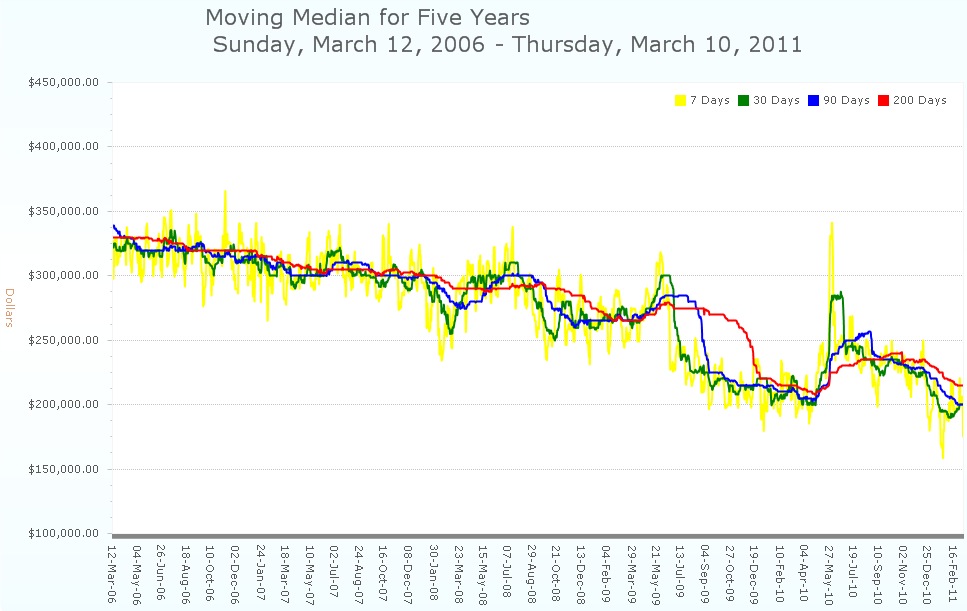
This is the moving median average price for homes in the Charlottesville MLS for the past four years.  – So for all intents and purposes, the report is somewhat irrelevant as it speaks to such a broad region. – Because Virginia is a non-judicial state, we most likely won’t be affected by the robo-signing issues. – Analysis of past two recessions compared to this one. This recessions’ recovery is stronger than 1991 and 2001, doesn’t feel like it due to in part to consumer confidence . – Three consecutive months of positive job growth in the state.
… Virginia Association of Realtors 3rd Quarter 2010 Home sales press release (PDF) and I’ll post the podcast when it’s up. Sales and Inventory for homes in Charlottesville MSA (PDF) — Check out the new graphs at the bottom .