If the fact that home sales are down, relative to previous months and years, comes as a surprise to you, you probably haven’t been paying attention. … And part of that “is” is that last month in Charlottesville and Albemarle, 85 single family homes closed and 22 attached homes closed. … Attached Home Home Closings in July for the past ten years : 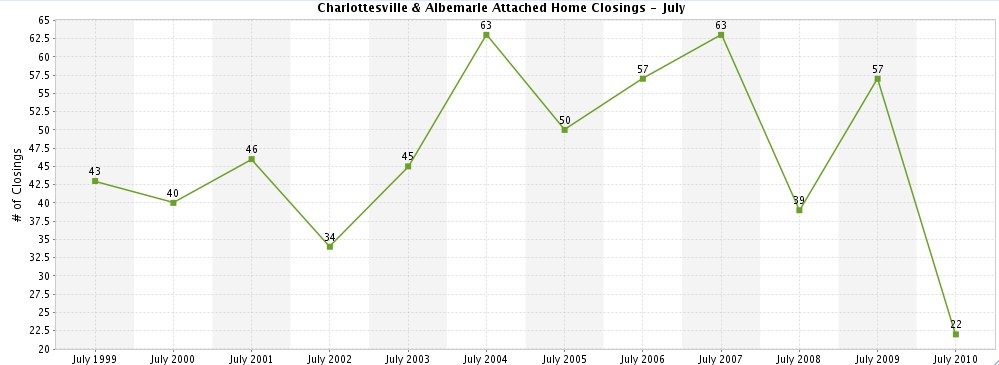 Single Family Home Closings in July for the past ten years :
 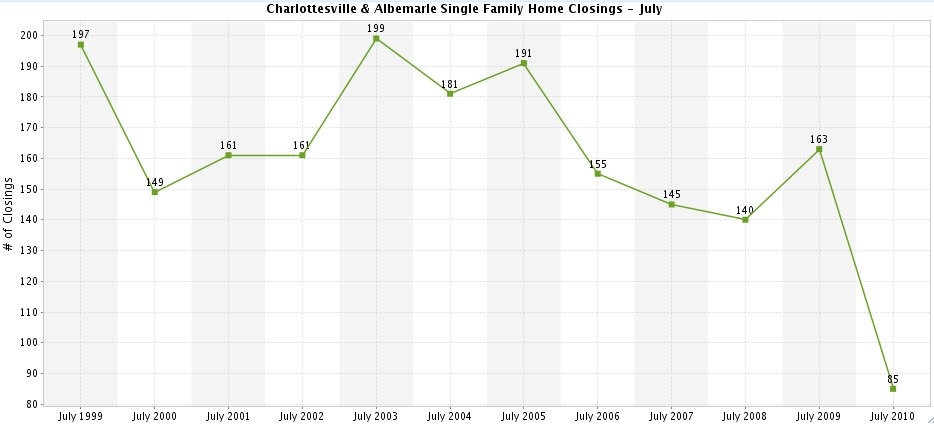 Now, looking back of June and July for the past ten years … The Spike in 2009 seems to be new construction attached properties in Abington Place , Brookwood and the Pavilions at Pantops (more on new construction’s impact on MLS data in a later post).
 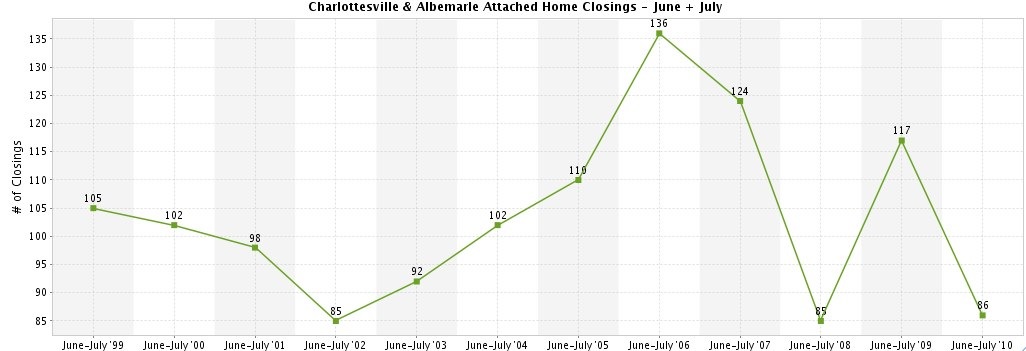 Single Family home closings in Charlottesville and Albemarle for the past ten years:
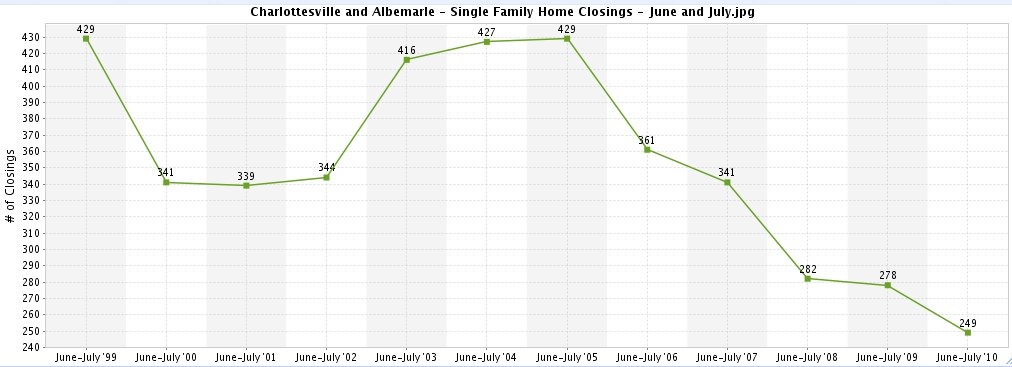
Posts tagged statistics
Friday Charts – Median Price in Charlottesville MLS
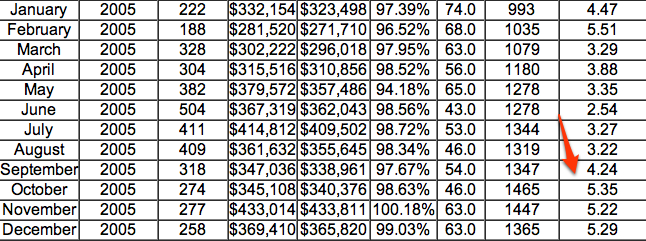
Keep in mind that below we’re looking at the moving median price for the entire Charlottesville MLS – inclusive of the Charlottesville MSA (Charlottesville, Albemarle, Fluvanna, Greene, Nelson) as well as outlying areas such as Madison, Waynesboro, Rockbridge, etc. … But … it seems that the median price has been increasing after the expiration of the homebuyer tax credit . 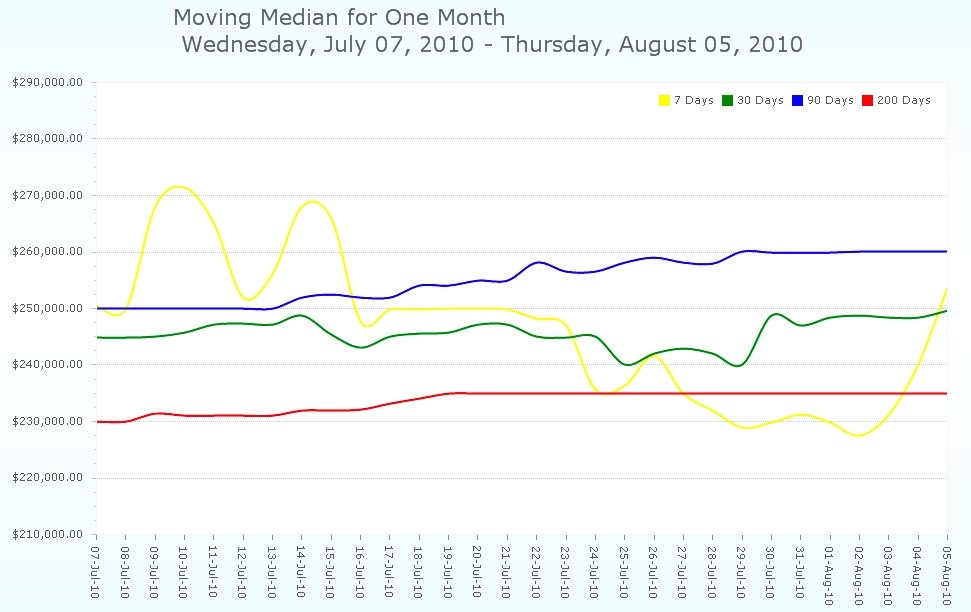 Looking at the moving median price for the past year …
  And for the past five years … I wish this chart allowed for more than five years, but stay tuned, we have some interesting things in the works at Nest .
 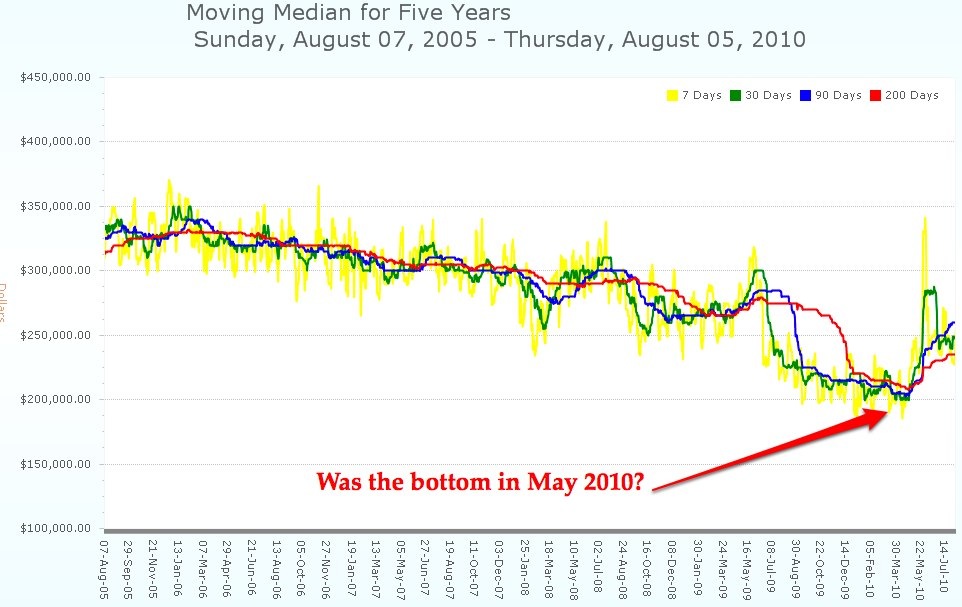 See all posts in the Friday Charts series . … Foreclosure charts courtesy of RealtyTrac : For Albemarle County:
 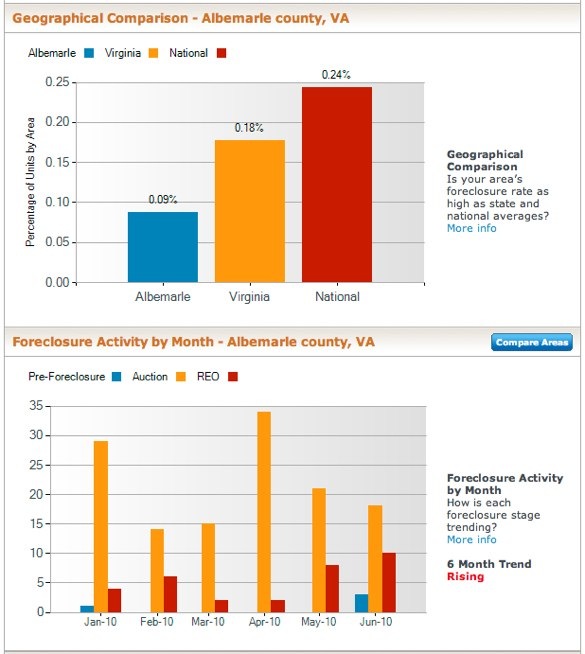 For the City of Charlottesville :
 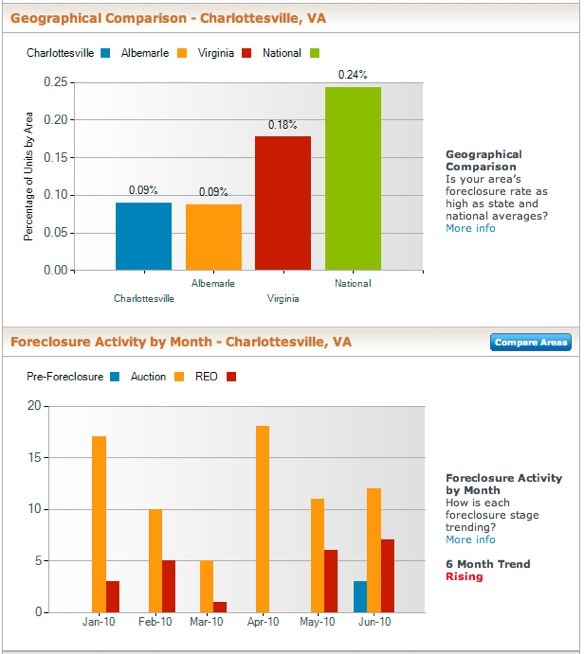 For Palmyra in Fluvanna County , which includes Lake Monticello : (they have more foreclosures per capita than Charlottesville or Albemarle)
 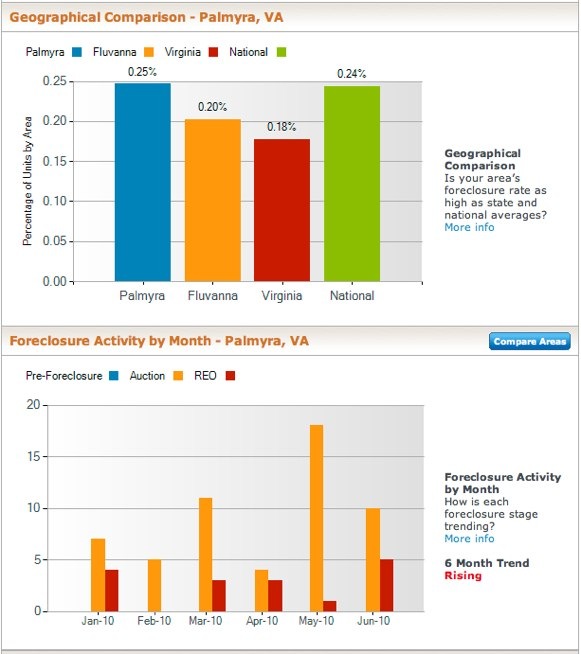 Of course, God only knows what our government might do … all of our analysis would be for naught.
Charlottesville Area Year-End Market Report
I’m still in New York for the Inman Connect conference, but wanted to post the Charlottesville Area Association’s year-end real estate market report. More analysis to come, as well as the forthcoming Nest Report. Charlottesville Area Association of Realtors Market Report 2009
Possibly Completely Unfounded Market Analysis
Ergo – is it reasonable to conclude that a house that has been on the market in Albemarle County (I’m not looking at any other market) for at least one year should now be “worth” at least 15% less than its original asking price? Looking at three randomly selected sold properties in Albemarle County in that price range in the past three months, the list-to sell percentage was a bit more stark – 85%, 75%,74% – sold for less than the original asking price.
Updated Market Report for Charlottesville Region
In anticipation of the soon-to-be-released “official” market report, here is some localization: When searching the entire MLS, there are currently* – 3,521 active residential properties – 557 under contract – 2,423 sold since 1 January 2008 For the purposes of this post, the charts and graphs show Albemarle, Charlottesville, Fluvanna, Greene and Nelson Counties. – 2,236 active residential properties – 347 properties under contract – 1821 properties have sold since 1 January 2008 – Nearly 15 months of inventory . …  Inventory/Absorption Rate
 ![]()
 Year to Date Average:
 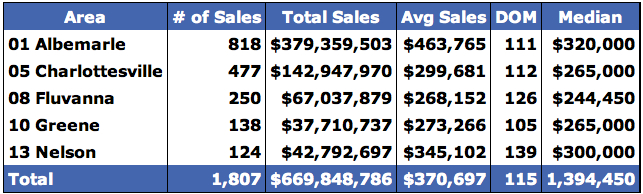 Realtor Update : Selfishly, I’d like to see a dramatic reduction in the Realtor ranks – it would help professionalism, competence and public perception.
New Construction, Median Sales Prices and Sales Volume for Central Virginia
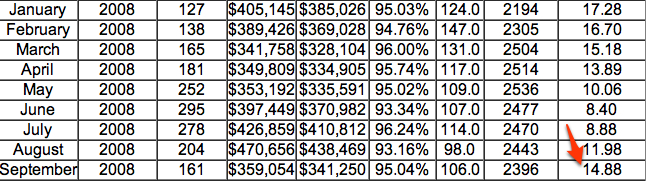
Albemarle County realeased ( sic ) numbers for the first part of 2008. 266 building permits for new residential housing units were issued in the first six months of 2008. … One of my goals for next month’s third quarter market report is to pull condos out of the equation so that we can better compare apples to apples. 2008 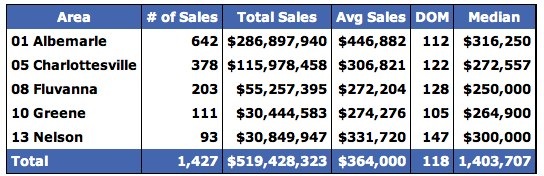 2007
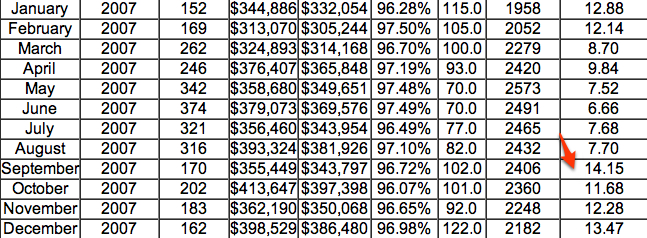
2007 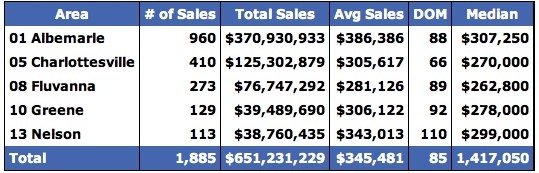 2006
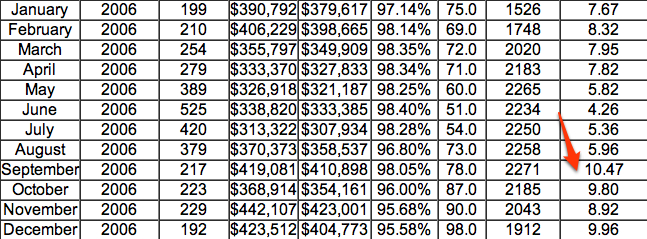
2006 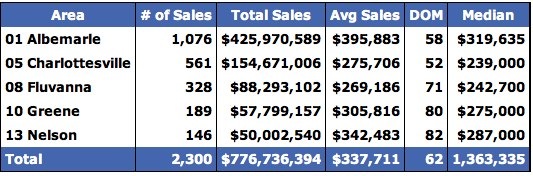 2005
2005 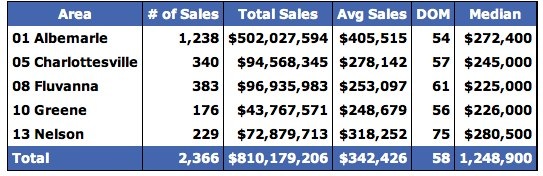 2004
2004  For an example of the condo component of the market (again, more detailed analysis coming in early September): Condo volume in 2008 in Albemarle County is down nearly 40% and condo volume is down in the City of Charlottesville is down about 35%. 2006:
  2007:
2007: 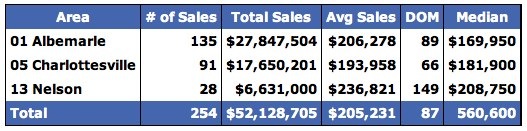 2008:
2008: 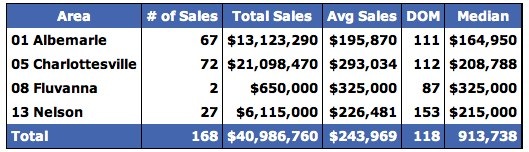 * this post is a good segue way into my post recapping my week so far in Austin, Texas .
A Market “Retort”
A clarification on their stats: There are 2595 properties on the market in the Charlottesville area, and 239 sold in July 2008, when defined as Albemarle, Charlottesville, Fluvanna, Greene, Louisa and Nelson. … I’ll be posting my own updated analysis in the next few days … it typically takes several days for all the data to be updated in the MLS.