For your review: The Nest Report for January 2011 (pdf) covering the Charlottesville Extended MSA (EMSA)*
* EMSA = Charlottesville, Albemarle, Nelson, Louisa, Greene, Fluvanna
Looking at Median Home Prices for the Charlottesville MLS – which encompasses a vast region – we can reasonably see some trend lines. At this macro/micro level, trend lines are all we can reasonably expect to see.
Keep in mind that the below charts are for everything – single family detached homes, attached homes, condos, farms, new construction, resale – the Charlottesville MLS does not allow for easily producing statistical charts (one reason that I have been doing so much statistical analysis on the Charlottesville real estate market for the past six years).
With the above caveat, we can see where we were and make some educated guesses about where we’re going.
Charlottesville MLS – Moving Median Prices – One Month

Charlottesville MLS – Moving Median Prices – One Year

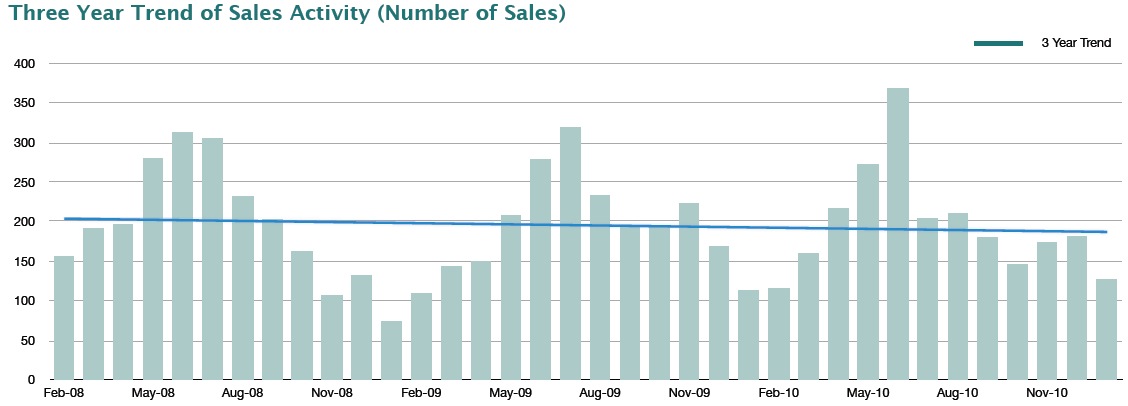
Charlottesville MLS – Moving Median Prices – Three Years

Charlottesville MLS – Moving Median Prices – Five Years
