Cash transactions in Charlottesville area – 2013
Posts tagged Market statistics
Nest’s 2nd Quarter 2013 Market Report
As promised yesterday, here is our 2nd Quarter 2013 Nest Report – what we believe to be the most comprehensive market report in the Charlottesville area. As always, if you have questions, please ask.
Download the market report here.
But … the caveat holds:
Nota bene – The data below may or may not apply to you if you’re currently contemplating buying or selling. This is aggregate data – meaning if you’re looking for a single family home in Ivy with 4 bedrooms and 2.5 baths, the data and brief analysis below also includes affordable new construction in the City of Charlottesville, a $1.2 million home in Ashcroft in the County and everything in between. In other words, if you have specific questions, ask me. I’m a real estate agent .
Looking in the Rear View Mirror – Previewing the 2nd Quarter 2013 Market Report
When looking at the real estate market (or any market, really) We’re always looking backward, thinking about today and trying to project tomorrow, next year and five years from now.
We’ll be posting tomorrow our 2nd Quarter Market Report for the Charlottesville area, and we’re making final edits and number crunching today.
I’m inclined to echo Bill McBride at Calculated Risk –
The “wide bottom” was what I was forecasting several years ago, and now I expect several years of increasing single family starts and completions.”
I think we’re in for at least 18 – 36 months of flatness, once the optimism of early 2013 fades and interest rates increase. Nota bene – The data below may or may not apply to you if you’re currently contemplating buying or selling. This is aggregate data – meaning if you’re looking for a single family home in Ivy with 4 bedrooms and 2.5 baths, the data and brief analysis below also includes affordable new construction in the City of Charlottesville, a $1.2 million home in Ashcroft in the County and everything in between. In other words, if you have specific questions, ask me. I’m a real estate agent .
That said, a few tidbits to whet your appetite for data for Charlottesville and Albemarle (Greene, Nelson, Louisa, Fluvanna coming tomorrow) –
Attached homes in Albemarle and Charlottesville* –
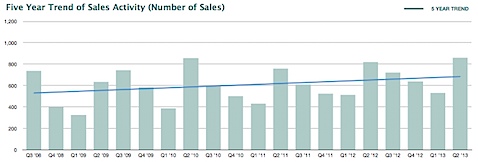
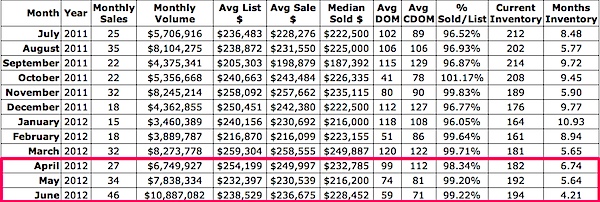
153 attached homes sold in Charlottesville and Albemarle in April, May, June of 2013 versus 107 in that same time frame of 2012 – a 70% increase in volume. A full third – 52 – of the attached homes sold were marked as “new.” (interestingly, only 4 attached homes sold in the Charlottesville MSA in that period).
If you’re looking at new attached homes, be prepared for little negotiation on price. If you’re looking at existing attached homes, be aware that you’re likely going to have more (and sometimes better) options as far as price and yard size.
Single family homes sales in Charlottesville and Albemarle
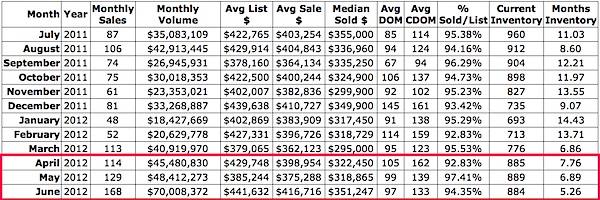
427 single family homes sold in the 2nd Quarter of 2013 in Albemarle and Charlottesville; 411 sold in the 2nd Quarter of 2012. I’d have been happy with flat sales, but a slight uptick is a good sign. In contrast with the attached home new construction numbers above, only 10% – 46- of closed sales in the 2nd Quarter of 2013 were marked as new construction. From my perspective, single family new home sales felt like they were more, but maybe that’s just because I’m around so much new construction all the time. (and this is a major reason I look at and embrace data over emotion and perception)
What impact will rising interest rates have on buyers?
1 – It will push some to act faster.
2 – It will cause some to not buy.
Looked at another way:
Buyers’ Purchasing Power
Let’s look at an example: A young couple is looking for a home and have predetermined that their budget will only allow them to spend $1,000 a month on a mortgage. At today’s mortgage rate of 4.5%, they could afford a $200,000 mortgage ($1,013 principal & interest). However, if rates jump to 5%, they would have to lower their mortgage amount to $190,000 in order to keep their monthly payment where they need it ($1,020). At 5.5%, the mortgage would need to be no more than $180,000 ($1,022).
The Impact on Prices
This decrease in buyers’ purchasing power will have an impact on home values going forward. We do not believe it will cause a decrease in prices. However, we do believe it will likely cause current rates of appreciation to slow.
Brief Look at Condo Sales in Charlottesville – 2nd Quarter 2013
Some quick numbers based on the 2nd Quarter market data for the Charlottesville MSA:
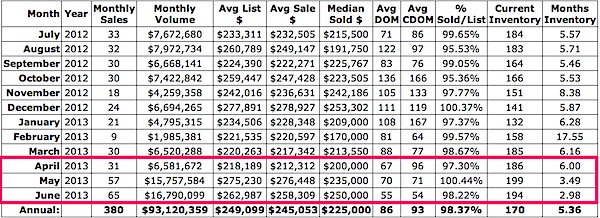
In the Charlottesville MSA: 35% fewer condos closed when comparing 2nd Quarter of 2013 to 2nd Quarter 2012 – 51 this 2nd Quarter versus 78 the previous 2nd Quarter. Why?
The answer is due in large part to the fact that the Walker Square and Riverbend condos, two of the largest condo conversions in the area, have sold out after long histories of conversion, rapid price appreciation, dramatic depreciation, ownership shifts and general market turmoil.
Consider:
– Last 2nd Quarter, 22 units sold in Walker Square. This year, that number is 5,
– Last 2nd Quarter, 8 units sold in Riverbend. This year, that number is 0.
One condo myth dispelled – condo financing is available in the Charlottesville area; you just need to know where to look.
Click through for the data.
Next up: attached homes in the Charlottesville MSA.
What’s the Most Popular Home Price Point in Charlottesville and Albemarle?
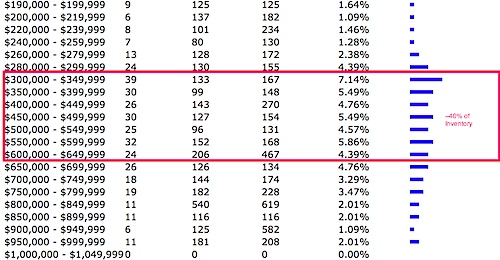
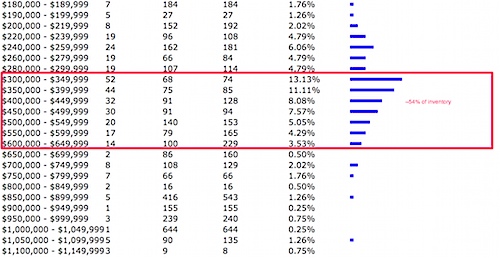
At a lunch with yesterday, I was asked, “what’s the most popular price point in Albemarle?” My professional instinct said “between $350k and $450k” but as always, I wanted to back that up with actual data.
Looking solely at single family homes in Albemarle County, about 40% of the active inventory is between $300k and $650k.
And the single family homes in Albemarle that have sold since the first of 2013, a greater percentage of the inventory has sold in the $300k – $650k price point than is active.
(if you’re curious to search the Charlottesville MLS for single family homes for sale in Albemarle)
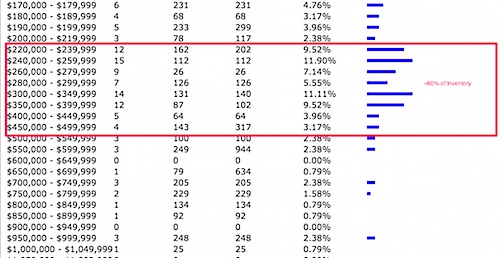
Great. That’s what’s for Sale and Sold in Albemarle County; let’s look at the home price distribution in the City of Charlottesville – nearly 60% of the active inventory is priced between $220k and $500k.
Looking at the single family homes that have sold since the first of 2013 in the City of Charlottesville, I was a bit surprised to see the relatively lower price point distribution, but not that about 60% of the inventory had sold in that price point.
Look for yourself …
(if you’re curious to search the MLS for single family homes for sale in Charlottesville)
Brief Market Snapshot for Charlottesville Area – May 2013
Homes are selling fairly well in the Charlottesville area. For this post, I was looking less at house prices, where things are selling, etc. and more for a snapshot of the market’s speed.
Per the Charlottesville MLS (and acknowledging that the numbers will shift as end-of-the month-closings are entered into the system:
Some things are looking pretty good … Initially I was working with data from the Charlottesville MSA, but I had to pull the data apart and limit my query to Charlottesville and Albemarle, single family and attached homes. I wasn’t looking for hard numbers (yet) but more a sense of how fast things are selling, and hopefully what the list-to-sale ratio was in April.
In Charlottesville and Albemarle in April, for only single family and attached homes (not marked as “new construction”: (yeah, I know this would look super-cool as a snazzy info graphic, but we make decisions based on data and insight rather than pretty pictures, right? 🙂 )
– 112 122 homes sold in April in Charlottesville and Albemarle
– 8 had continuous days on market of 3 or less — average DOM was 2; homes sold for 99.3% of the asking price – Price per square foot: $151
– 32 had continuous days on market of 15 or less — average DOM was 7; homes sold for 98% of the asking price – Price per square foot: $145
– 43 had continuous days on market of 30 or less — average DOM was 10; homes sold for 97.8% of the asking price – Price per square foot: $143
On the other side of the days on market conversation:
– 43 had continuous days on market of 90 – 120 days — average DOM was 189; homes sold for 94.6% of the asking price – Price per square foot: $148
– 10 had continuous days on market of 120 – 180 days — average DOM was 140; homes sold for 95.5% of the asking price – Price per square foot: $143
– 25 had continuous days on market of > 180 days — average DOM was 240; homes sold for 93.9% of the asking price – Price per square foot: $154
Short story: YOUR MARKET will vary. But – price your home just right you’re going to be better positioned to sell your house faster for closer to the asking price. Here’s the thing – there’s an outside chance you might sell your home for a little bit more if you wait for that one buyer.
Home Sales in Charlottesville Down, Contracts Up, Market Turning?
YOUR market will vary.
Even though this is what we believe to be an extremely accurate market report, it’s still a broad-brush report.
Mill Creek will have different inventory levels and absorption rates than will Old Trail, or the Gleason condos. As will different price points. i.e. – low absorption rate at $1 million + , high absorption rate in the $300k – $400k price point.
Dig in, get educated, ask questions, either in the comments below or email or call me anytime.
This is an example of how saying “sales are up” or “sales are down” doesn’t tell the whole picture.
For all residential sales year to date in the Charlottesville MSA:
Very broad takeaways –
– Inventory levels across the MSA are up, sales are down.
– Quality inventory is anecdotally way down
– In some market segments, multiple offers are common place.
– New construction is going to be a huge market segment – for better or worse.
– Being prepared to act fast – whether as a buyer or seller – is crucial.
The full report is embedded below, or download it here.

