Posts tagged Market statistics

Three Charts Depicting the Charlottesville Real Estate Market Entering December 2013

Curiosity stole an hour of my morning … I intended to update only the Crozet “When do homes come on the market” spreadsheet, got lost there for a bit and decided to look at the Charlottesville MSA numbers.

2012’s Charlottesville MSA sales trends – looking at when homes came on the market, when they went under contract and when they closed.

When do homes Come on the market in Charlottesville - 2012

And 2013

Well, this is interesting.

When do homes Come on the market in Charlottesville MSA - 2013

And the differential between 2013 and 2012.

When do homes Come on the market in Charlottesville - 2012 versus 2013 - differential

Read More

Questioning the Data – 3rd Quarter Nest Realty Market Report

2013 Q3 Cville Nest Report - 5 Year Sales Trend

The third quarter of 2013 ended with a neither a bang nor a whimper, but a nice, consistent breathing pattern. As it stands right now, recovery seems to be in full swing.

I’ve said for years to question the data – whatever its source (it’s why I tend to provide raw data for readers to vet). If you’d read the market report from CAAR last week, you’d have been reading inaccurate conclusions different conclusions than the ones in our report. I won’t go point-by-point through the discrepancies (but will in my monthly note), but will say simply: the conclusions are wrong. We look at data differently using the same sources. As I’ve said for years – question everything (even the stuff I write – and ask me your questions).

Download the full 3rd Quarter 2013 Nest Report

If you watch national news you’d see:

September existing home sales fall 1.9% (USA Today)
USA Today is much the same as the NAR’s blog post
Existing Home Sales in September: 5.29 million SAAR, Inventory up 1.8% Year-over-year (Calculated Risk)
– and then we have Zero Hedge: Existing Home Sales Plunge At Fastest Pace In 15 Month As Affordability Drops To 5 Year Low

Those trends are evident in the Charlottesville area as well. As prices rise, sales volume drops.

Some quick year over year numbers for the Charlottesville area:

MSA – sales volume up 19%
Albemarle – volume up 16%
Charlottesville City – volume up 16%

Single family home prices, long the bellwether for the housing market:

MSA – up 10%
Albemarle – up 16.2%
Charlottesville – up 12.5%

Your micro market will vary.

Update: so I upset a few folks with my calling the CAAR report “wrong” and “inaccurate”. I apologize for my tone, but remain 100% confident that the numbers I and we present are accurate. We do use different methodologies when looking at the data.

I’m not trying to pick a fight and could have been more diplomatic in my original post’s tone. For that, I apologize. I cannot apologize for presenting accurate data to my readers and clients.

Read More

3rd Quarter Market Report for Charlottesville MSA

The news and trends in the Charlottesville market are mostly good.

– Distressed sales are down (but they’re still out there)
– Well-priced homes that are turnkey are typically going under contract in under 60 days. Quality inventory remains a challenge.
– Prices seem to be up across the board.
– Note that these are broad overall trends. Long-time readers know my caveats that “single family homes in Charlottesville City” means all single family homes in the City of Charlottesville … those that are priced below $200k and those that are priced above $600k … and everything above, below and in between. See the chart below for a reasonable justification for questioning all data.

Listing stats.jpg

Download the full 3rd Quarter Market report here or click through to read an embedded version.

Read More

What is the list to sales price ratio for homes in Charlottesville?

I have long told my daughters to question everything and never accept at face value what they’re told. Same goes for real estate data.

What’s the list to sales price ratio for homes in Charlottesville?

Avg Sale to Orig List $ Ratio - Greater Charlottesville

It’s a good question.

The list to sale ratio is a great number to know – whether you’re buying a home, selling a home (or advising buyers or sellers). This ratio is a solid indicator the movement of the market, whether sellers are pricing well and correctly and whether buyers are paying close to asking price. Unfortunately, at its aggregate, it’s a garbage number. If you’re trying to use this data point as you try to figure out the market – ask questions. Always.

I randomly picked 10 sold homes from the Charlottesville MSA across the price ranges from $100k to one million. (I did this last in 2010 in which I chose 6 homes … the results were the same.

– No foreclosures or short sales

– Sold in September 2013

– No new construction

– Determining Days on Market was a challenge as well. Some of the homes I selected were on the market for less than 30 days while I made an editorial

Take the below for example. The “Original List Price” for this listing was $439,000. The actual original listing price was $510,000 – when the home was listed previously with another firm.

– Taking the top level analysis from the MLS yields: the list to sales price ratio was 94.9% of asking price.

– Running the numbers manually puts the ratio more in the 88% range. (if you were to include the listing prices from the original list date ~ 4 years ago …)

– The real, actual list to sales price ratio for the randomly-selected homes – just over 80%.

This story is neither scientific or necessarily representative of what the market-wide list to sale price ratio may be. This is merely a reminder to question. Everything.

Continuous-days-on-market.jpg

Read More

Comparing 2012 and 2013 – When Do Homes Come on the Market in Charlottesville?

I hadn’t updated this chart in about 18 months, and I was curious … one of the most common questions I get is “when do homes come on the market in Charlottesville?” Typically this question comes in one of three conversations: (I’m going to do a series answering these questions – to be published the next two Wednesdays) –

I’m thinking about putting my house on the market – when does the Charlottesville market start? (short answer: Take pictures now)

I’m thinking abut buying a home in the spring – when do most homes come on the market? (short answer: Fall/Winter is the best time to begin your home search. And an even better time to hire buyer representation so your search process is less frustrating, more efficient and better.)

– I’m curious. What’s the market like? (note the third chart to see what my curiosity led me to)

A few differences between the following charts and the one from January 2011:

– “Charlottesville” = Charlottesville, Albemarle, Fluvanna, Greene, Louisa, Nelson (in 2011 I didn’t include Louisa)

– Only Single Family, Attached and Condos results are included – not “proposed” – meaning not new construction, paper lots, aren’t included

That said –

Let’s look at some numbers. 2011 was interesting, with the new listing bump breaking the traditional mid-year inventory decline right after the start of the autumn school year – a trend that occurs every year.

And 2012?

list-contract-closed-Charlottesville MSA 2012

So … how’s 2013 looking?

– The contract peak was in May of this year versus April of 2012 – As I said in my monthly note recently, the frenzy of the early spring filled with hope and confidence was tempered early.

– Inventory levels for 2013 are pretty much on track – across the MSA – with 2012.

When do homes Come on the market in Charlottesville MSA? 2013

The differentials between 2013 and 2012 are fascinating. Look at the peak in Contracts.

– I’m speculating that the increase in inventory in July/August is due in part because some sellers saw the hope in the market and success their neighbors were having in selling and thought that now would be the right time for them to try to (finally) sell.

Differential - 2013 versus 2012 -When do homes Come on the market in Charlottesville

Read More

Do Sellers in Charlottesville Pay Buyers’ Closing Costs?

Sometimes a post in which I pull data to answer a question becomes a bit more than intended. This is such a post.

– Do sellers pay closing costs? – Are we at a sustainable volume of closed transactions? – FHA is helping foreclosed buyers.

Do the sellers pay closing costs? Is one of the more common questions I get, whether I’m representing buyers or sellers.

A quick look at 2013 so far, 1991 homes have sold in Charlottesville, Albemarle, Fluvanna, Greene, Louisa, Nelson. Of those, 518 have something entered into the “seller concessions” field in the Charlottesville MLS, so presumably, about 26% of transactions this year have had some sort of seller concessions.

Last year those numbers were 1,864, 556 and 29%, respectively.**

But really .. what do “seller concessions” mean?

– The seller “paid” the buyers’ closing costs. (not really)

– The buyer is financing the closing costs over the life of the loan.

in other words:

– The seller is accepting a lower net offer

– The buyer is paying a higher net offer.

For example – if a seller is asking $450k and the buyer offers $440k with the seller “paying” $10k towards the buyers’ closing costs, the seller is looking at a net offer of $430k. The seller doesn’t care how that’s structured; they’re looking at a net offer of $430k.

** Just because I’m naturally curious, I looked at the number of closed transactions in the Charlottesville MSA in the January – August timeframe in 2007 … 2,336. And 2006 … 2,824. So, from a pure volume perspective, our market is down 30% from the peak. As noted in 2012 – I’ll Know Housing Recovery in Charlottesville When I’ve Seen It

Transactions – volume of transactions – what is normal volume of sales transactions in the Charlottesville MSA? I don’t know; homeownership rates are declining. Last year, 1755 single family homes sold in the Charlottesville MSA (including Louisa). In 2002, 2479 single family homes sold. I’d put the “sustainable” rate of single family home sales somewhere in between those two numbers.

We might be getting close to a sustainable recovery.

One sign of the recovery that I called years ago? Those who were foreclosed on are now eligible for new loans – a year after foreclosure.

Read More

6 Things to Watch in 2013 – Confidence and Frustration

Nudge-2.jpg
always looking for hindsight. Today.

In January two of the six things I noted to watch were:

More confidence in the market as unemployment stabilizes (underemployment is a different conversation). More stability is likely to mean more buyers

Frustration felt by buyers who are seeing prices rise (again). If prices do indeed start to rise again, many buyers will be kicking themselves for waiting. Some are predicting national home prices to rise by nearly 10% this year; if this happens (and I hope it doesn’t), expect to see more discussion about another bubble. But … if you’re confident you’re going to be in the Charlottesville area for the next 5-7 years, it might be worthwhile to have a conversation about buying a home.

Last week I looked back at Apartments.

Confidence. Buyer (and seller) confidence, consumer confidence, builder and real estate agent confidence … and frustration felt by buyers as the market turns.

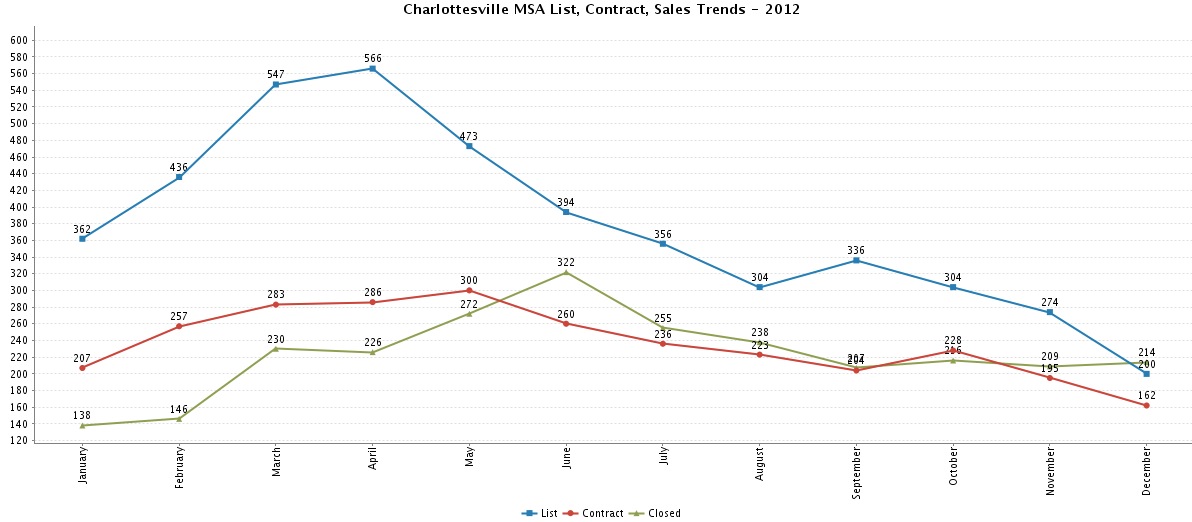
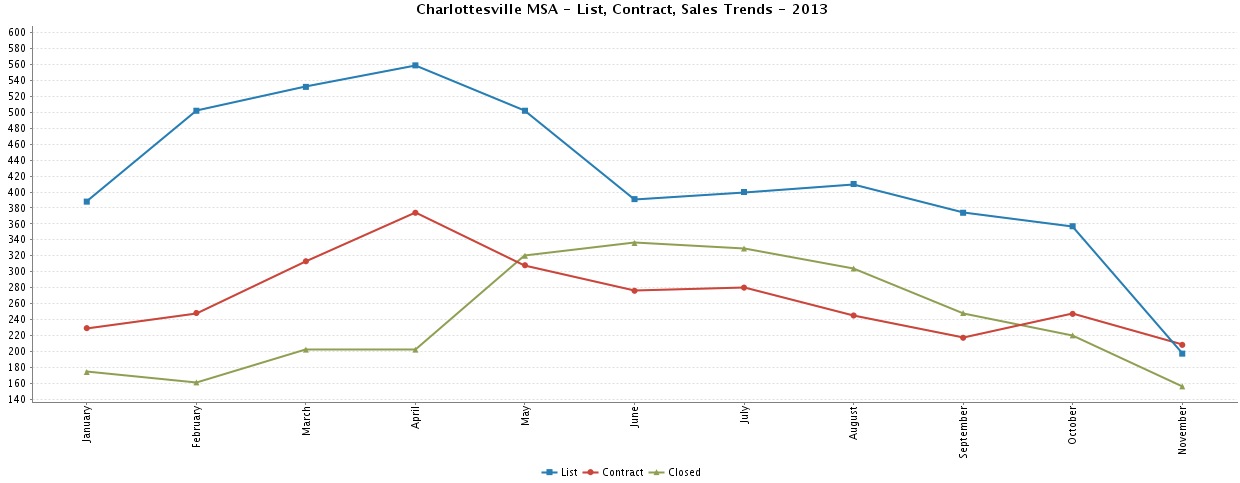
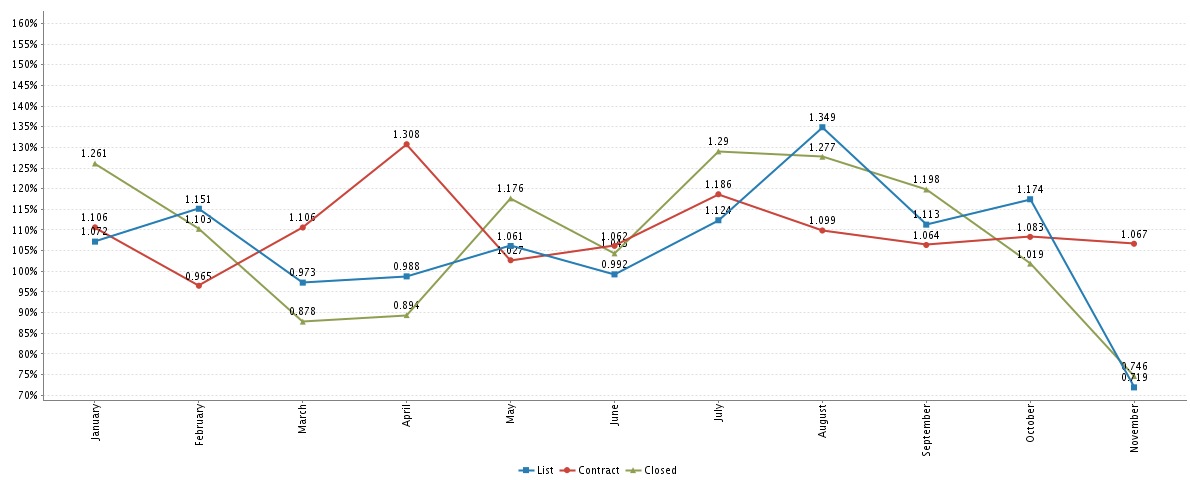
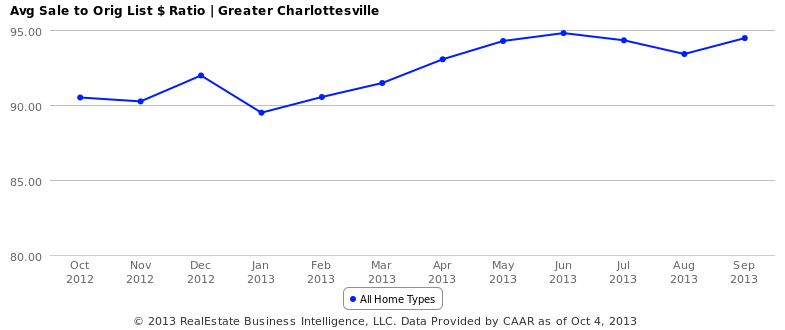
Now that it’s August, I can say with confidence – We’re in an odd time right now. There is a great deal of (over) confidence and a seemingly balanced level of trepidation in the market. The Charlottesville real estate market recovered with a storm in early 2013 – the pace was rapid, bidding wars were common and sellers were justifiably optimistic. Things seem to have tempered a bit now.

Takeaways from this post:

– Builders are building a lot right now. Very few are building communities in addition to houses.
– Single family homes sales are up July to July – Albemarle is up 23%, Charlottesville is up 5% (really – 2 units), and other counties are mostly flat (click through to see the charts at the bottom).
– Interest rates are up – from the mid 3’s in early 2013 to mid-4’s now. (click through to see the 30 year chart for some perspective). Historically, interest rates are crazy low, but the jump from unreasonably low to more moderate has absolutely affected buyers’ buying ability, sellers’ ability to sell and confidence on both sides.

– If you’re considering buying or selling right now or in the next 6 months, ask questions (you could start by asking me) – there are a lot of moving parts in today’s market and every life situation is different. There is no one answer “buy now!” “sell now!”

– Confidence is an individual concern; market sentiment is one thing, but “will I be employed next year?” is something only you can answer. But … the Charlottesville MSA Unemployment Rate remains relatively low. The underemployment rate? Different conversation.

Charlottesville, Virginia Metropolitan Unemployment Rate and Total Unemployed | Department of Numbers.jpg

Cost of Buying a Home Affects Confidence & Purchasing Decisions

Nudge-1.jpg

Think about this; as interest rates go up, so does the cost to buy (and own) a home, only for Principal and Interest (not including Taxes and Insurance):

– Loan amount of $300k. Interest rate of 3.5% = monthly payment of $1,347.13
– Loan amount of $300k. Interest rate of 4.5% = monthly payment of $1,520.06

A difference of $172.93 – That’s real money. Grocery money, gas money, vacation money.

On the confidence matter, the NAR succinctly states:

A confluence of factors tempered REALTOR® optimism: higher mortgage rates, rapid price gains amid a slow economic recovery, lack of inventory in many areas, and stringent credit conditions.

Well said.


Buyers are frustrated –

– Interest rates are rising

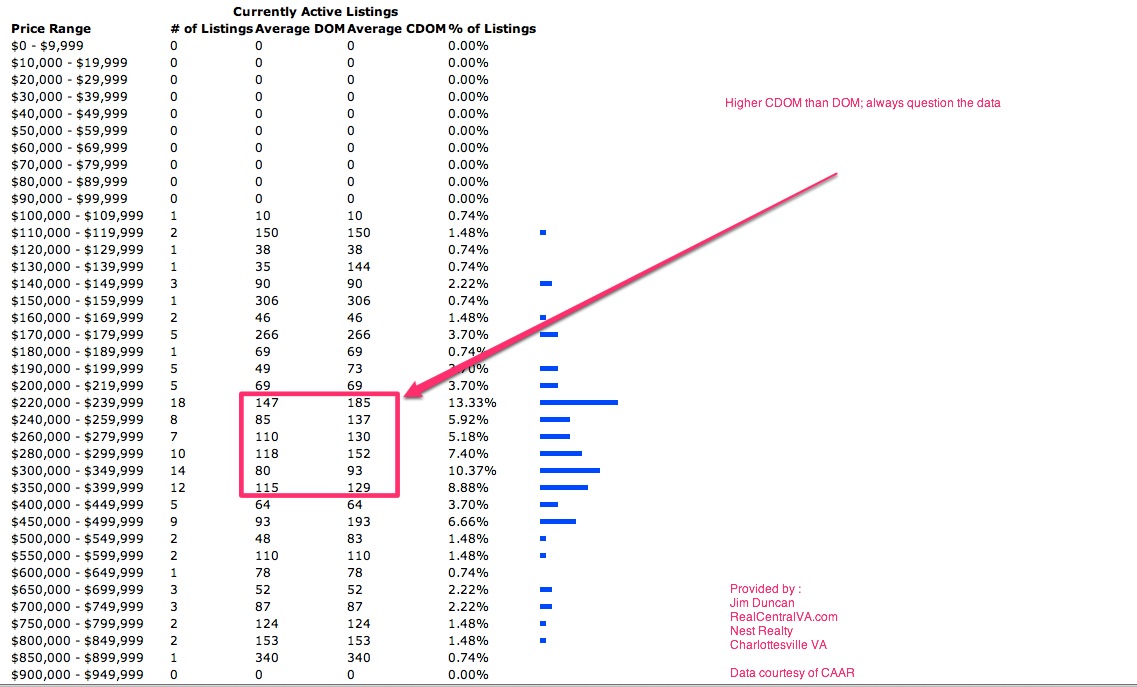
– Many are able to sell their existing homes, but those who want to buy (and have wanted to buy for a while) are finding that Quality Inventory remains low. (I’ll touch on inventory in my next post). Buyers aren’t buying property because they want to buy a property, they’re looking to buy homes.

– Sellers – if you want to sell, price right and make your home as close to perfect as possible.

Mortgage Rates - Today_s Home Loan Rates and Trends | Zillow

Read More