This month, I’m embracing fallibility. 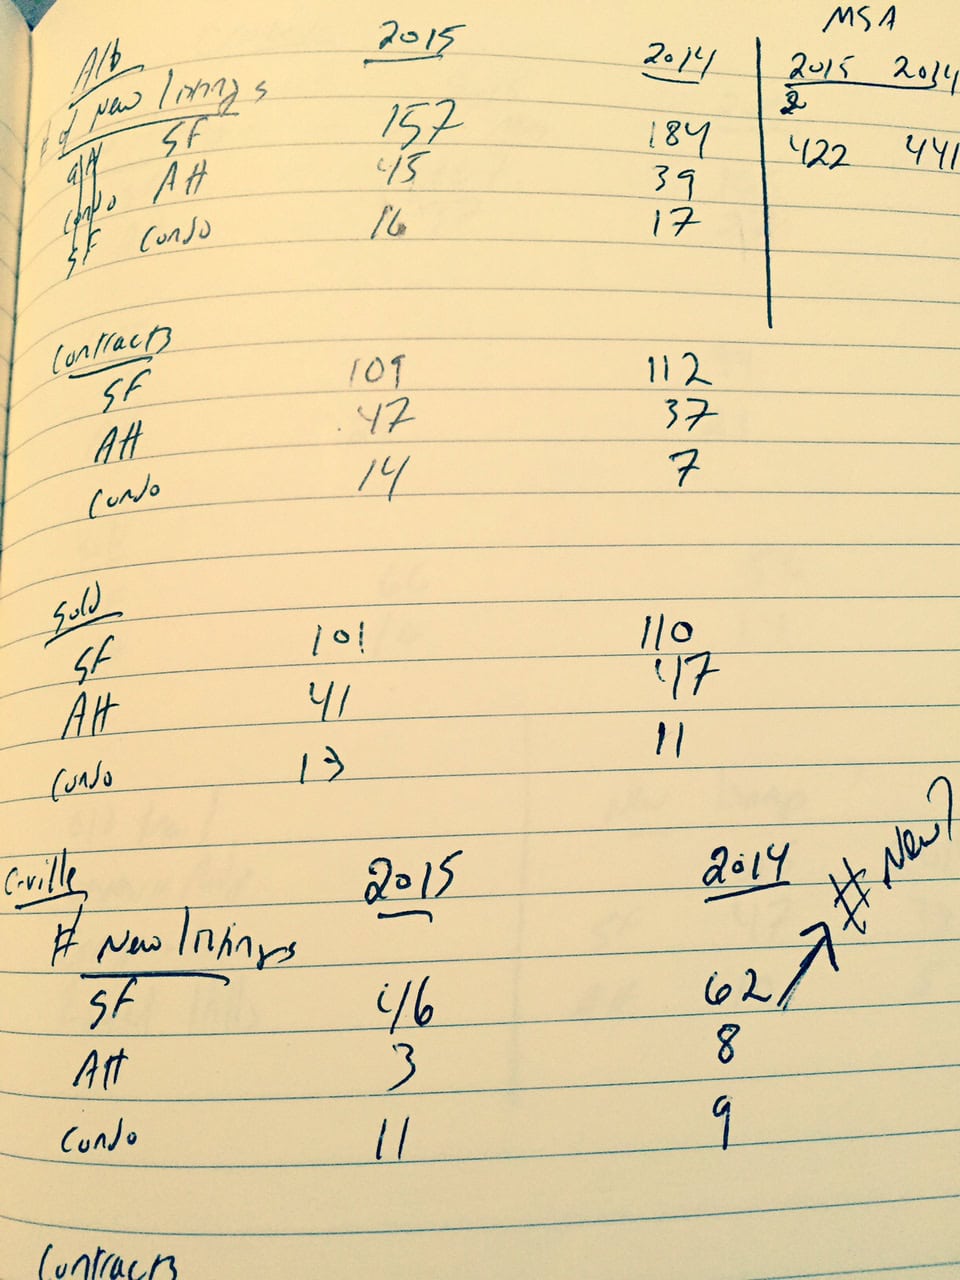
Bad things can happen when I don’t listen to the editors. In this case, that “bad thing” is confusion amongst readers. If you’re interested in the Note, please subscribe here.
Also note that were I to run the following numbers today, they would be slightly different as data tends to get input into the Charlottesville MLS days and sometimes weeks after closings occur. That said, these numbers are reasonable enough to see trends. If you’re curious about what’s happening in your neighborhood, or if you’re thinking about buying and have questions, please ask me.
The following is what I wrote, and published –
Next month’s note is going to be a bit more data-heavy as I dig into the mid-year numbers. (edit: true. The Mid-Year note is going to be a mix of my data and Nest’s Mid-Year Market Report).
May in Albemarle County:
# of New Listings – 2015 vs. 2014:
Single family homes: 157 vs. 184
Attached homes: 45 vs. 39
Condos: 16 vs. 17
Total: 218 vs. 240 — 9% up; optimism by late-to-Spring market sellers? (correction – I got them backwards! 9% DROP – less new inventory this May versus last May. I should have caught this without editors’ — or awesome readers — help as I’ve been saying and feeling all year that it seems there’s been less new and good inventory).
# of Contracts:
Single family homes: 109 vs. 112
Attached homes: 47 vs. 37 (10 of the 47 were new construction; 13 of the 37 were new)
Condos: 14 vs. 7 (Contrast with last month’s 8 vs. 16 shows the perils of trying to draw conclusions from limited data sets.)
Total: 170 vs. 156 — up 8% isn’t bad.
of Solds
Single family homes: 101 vs. 110
Attached homes: 41 vs. 47
Condos: 13 vs. 11
Total: 155 vs. 168 — up 8% isn’t insignificant — (edit: really, down 8% — fewer solds are likely balanced by the increase in contracts, when looking at the total year.)
May in the City of Charlottesville
of New Listings:
Single family homes: 46 vs. 62
Attached homes: 3 vs. 8
Condos: 11 vs. 9
Total: 60 vs. 78 — up 23%. Interesting.
of Contracts:
Single family homes: 44 vs. 44
Attached homes: 9 vs. 7
Condos: 7 vs. 12
Total: 60 vs. 63
of Solds:
Single family homes: 53 vs. 41 (I still think this is driven by pocket listings not being entered into MLS. And I’m still working on sussing this out.)
Attached homes: 8 vs. 10
Condos: 5 vs. 7
Total: 66 vs. 58 — Up 12%
————————————————————————
Those many who wrote pointing out my mistake: thank you. Thank you for passing the reading test that I clearly so deliberately put together to test you to see if anyone was reading. I’ve made a donation to the Blue Ridge Area Food Bank as thanks.