
“Should we buy a home in the Charlottesville City School district or Albemarle County Schools?”
(and why are there two districts instead of just one? One makes sense)
That question is one that my buyer clients ask all the time; schools are one of the top three things on which buyers will not compromise.
This story started with a tweet by Matthew.
“Albemarle County Schools vs. Charlottesville City Schools – a mega thread”
@k12albemarle @CvilleSchools Fairly commonly held belief: county schools are better than city schools, especially from folks moving in from out of town.
And continued on and on, with loads of facts, data, information and context. So much information that I thought would be 1) useful for my clients and 2) better captured in a blog post.
Albemarle County Schools vs. Charlottesville City Schools: Which is Better?
by Matthew Gillikin
I’ve lived in Charlottesville about ten years and when the area public schools come up in conversation, I have often heard something along the lines of “Well, we want to live in the county because the schools are better, especially in western Albemarle.”
This catches my attention for a few reasons. One, my family is pretty tied in with the city schools – my wife is a teacher at Jackson-Via Elementary School, where my oldest son just started kindergarten (Go Jackrabbits!!).
Two, I’m fascinated by the reasons people end up living anywhere – there’s always a good story behind it. However, frequently it seems many families decide where to live based on a combination of anecdotes, on-line school reviews, and pre-conceived notions about suburban and urban schools. The facts about actual schools do not figure into the equation as strongly as perhaps they should.
So, if you like to make major life decisions based at least in part on facts, keep on reading.
I spent some time recently looking into some of the data on the Albemarle County Schools (ACS) and the Charlottesville City Schools (CCS). I pulled a bunch of number from the Virginia Department of Education (VDOE) website, which has reams of information about every school and school district in the state.
First, some general numbers about Albemarle County and the city of Charlottesville. These are two separate entities with their own governments, police and fire departments, school systems and more. It’s an unusual way to do things, but in Virginia cities are distinct from the counties surrounding them. Nearly all of these numbers are pulled from Census data, as well as some from the Weldon Cooper Center at UVA.
| Albemarle County | City of Charlottesville | |
| Population (2016 estimates) | 105,715 | 49,071 |
| Land Size (square miles) | 720.7 | 10.24 |
| White (non-Hispanic) | 77.3% | 65.7% |
| Black | 9.9% | 19% |
| Hispanic or Latino | 5.7% | 5.3% |
| Asian | 5.1% | 7.6% |
| Two or more races | 2.5% | 3.1% |
| Median Income | $70,342 | $50,727 |
| Median Cost of Owner Occupied House | $317,300 | $280,100 |
| Median Rent | $1,156 | $1,030 |
| Poverty Rate | 9.7% | 25.9% |
| Poverty Rate excluding post-secondary students | 8.3%* | 15% |
| Residents who are post-secondary students | 6,303** | 8,590 |
| Poverty Rate for Families with Children | 9.9% | 20.3% |
* This my estimate of the Albemarle County non-postsecondary student poverty rate following the method described by the fine folks at Weldon Cooper Center.
** Additionally, around 6,500 UVA students live on campus (which is technically separate from the County and City).
Turning from the big picture, now some basic numbers on school systems (from 2016-2017). You can see that CCS is a much smaller school system than ACS and also has a higher percentage of minority and low-income students.
| ACS | CCS | |
| Number of Students | 13,818 | 4,478 |
| Schools | 3 high schools
5 middle schools 15 elementary schools (plus a small charter school, alternative school, CATEC, etc) |
1 high school
1 middle school 1 upper elementary school 6 elementary schools (plus alternative school, CATEC, etc) |
| White | 65% | 39% |
| Black | 11% | 35% |
| Hispanic | 12% | 12% |
| Two or more races | 5% | 6% |
| Asian | 5% | 6% |
| Native American/Alaskan/Hawaiian | <1% | <1% |
| Economically Disadvantaged | 29% | 57% |
| English Language Learners | 10% | 14% |
I found some data on teachers and classroom size:
| ACS | CCS | |
| Student/teacher ratio | K-7: 11.32 to 1
8-12: 11.63 to 1 |
K-7: 11.14 to 1
8-12: 8.25 to 1 |
| Classroom ratios | Could not find data for ACS – suspect similar to CCS | K-4: 19-24 to 1
5-8: 19.5 to 1 9-12: 20.5 to 1 |
| Fully accredited schools | 96% | 100% |
| Teachers with master’s degree | 59% | 63% |
| Funding per pupil | $13,011 | $16,084 |
Some data on high schoolers:
| ACS | CCS | |
| Students receiving advanced diploma | 63.5% | 49.7% |
| On time graduation rate | 94.7% | 89.6% |
| Students in AP courses | 24.6% | 37.5% |
| Students in dual enrollment courses | 19.7% | 16.1% |
I spent a good amount of time looking on the Virginia Department of Education’s website at the Standards of Learning (SOL) data for the two divisions.
Plenty has been said about the pros and cons of SOLs, but at the least they can be a useful (and relatively easy to find) measurement for comparing how well schools and school districts are educating their students. Additionally, because the scores are broken into categories such as race/ethnicity, gender, economics, and more, it can be a rough guide for understanding how a school or school district educates different types of students.
(Jim’s note: Look Beyond the Test Scores When Evaluating Schools)
I created some tables, breaking the data down in a few different ways. These numbers are pulled directly from information on VDOE’s website.
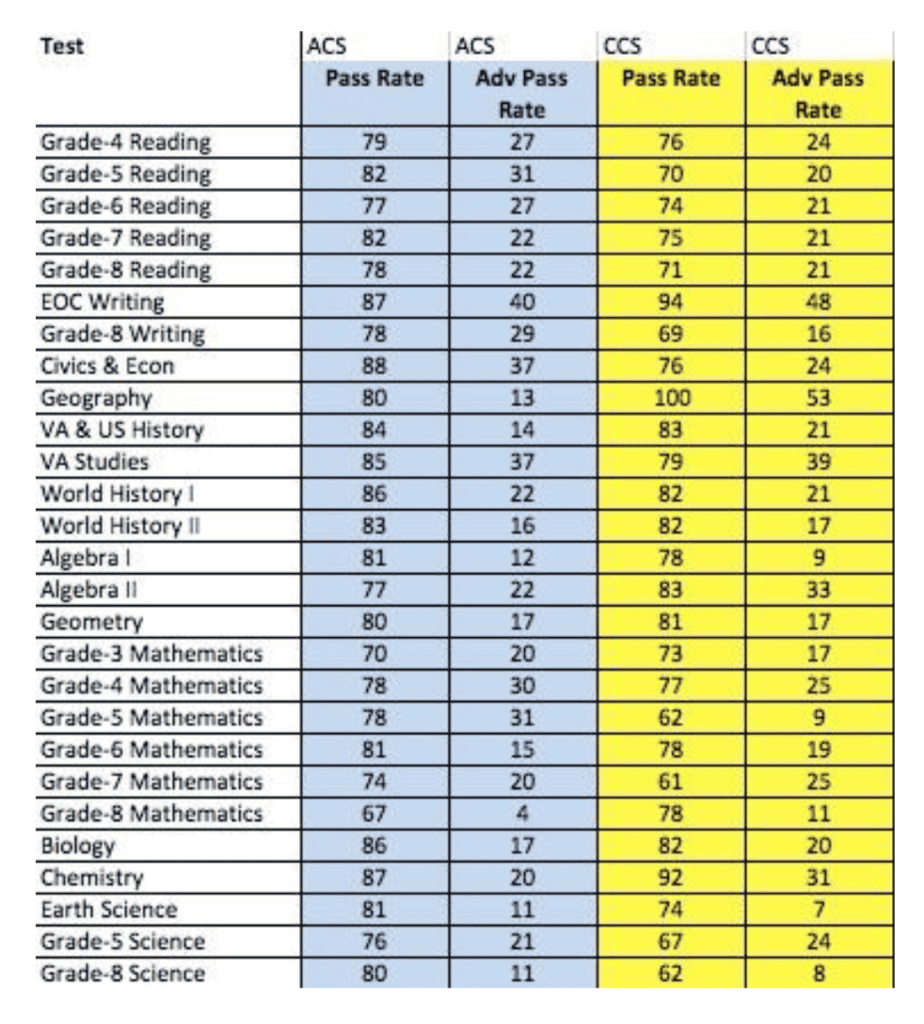
Here are the overall pass rates for all students taking SOL tests in ACS and CCS. This includes a bunch of different tests for kids starting in 3rd grade through high school, all of which fall into five categories.

Here are the pass rates and advanced pass rates for all the SOL’s administered. You’ll notice that the scores are generally similar – ACS better in some areas and CCS better in others.
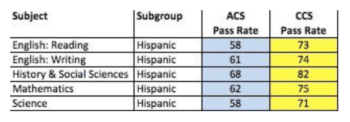
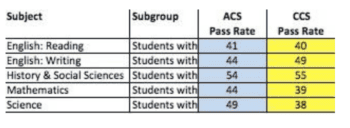
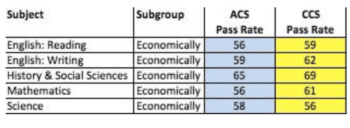
Here is where, in my opinion, things get really interesting – when things are broken down into subgroups
Asian students

Black students

Hispanic students
White students

Students with disabilities
Economically disadvantaged students
English language learners

Females
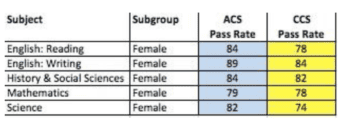
Males
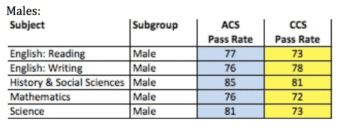
A few observations
- There are some pretty big achievement gaps in both school systems.
- Asian students score higher in ACS, Hispanic students higher in CCS, but I’d be curious how many of each group are also language learners, as CCS better SOL scores for ELL students.
- For white and black students, outcomes are pretty similar in both school districts.
Conclusion
Both school districts, though not perfect, are quite good! They are well resourced and generally strive to educate all their students. Proceed accordingly!
For more information on specific schools, see schoolquality.virginia.gov.
Really interesting email comment … posted with permission, and anonymized.
I read the thread on the school data and overall agree. one point of data that might be interesting between the districts is how often the schools get social services or CPS calls. while we loved (our former school), the reason why we moved … from there was that there were so many kids being disruptive, aggressive to the point of having to go to the principal’s office.
CPS had to come in almost daily, which is a huge distraction from learning and hard to see friends being pulled out of class in elementary school. we didn’t think with all that distraction going on that (he/she) was getting the education he(/she) needed because of all the distractions in the classroom.
I’m not saying () schools are overall better in this regard, however so far at (our new school) this is not an issue. maybe it’s the size of the school, much bigger, so maybe the disadvantaged kids are more spread out?
anyway, thought that might be an interesting data point as it was a factor for moving (our kid) out of () schools. nothing to do with test scores or academics beyond being an environment where he(she) can focus on learning.
Thanks for this response. Sorry it has taken me awhile to respond.
First, Child Protective Services (CPS) is not called because a child is acting out in school. CPS is callen when someone (it could be anyone, but it is usually a “Mandatory Reporter”) thinks a child is being abused or neglected in his or her home environment. When CPS is called and they decide to investigate while a child is at school, the child is usually quietly asked to go to the office where they are interviewed. It does not disrupt the classroom. If it is disruptive or if anyone other than those who need to know become aware that CPS is present, someone is not doing their job correctly.
Second, I went to see if there was VDOE data on school behavior. I found some that has no connection to CPS data (because that is about what happens or is suspected to happen in the home), but is about what school report about certain behaviors in the school (the categories are: substance abuse, technology offenses, offenses against other students, offenses against staff, weapons offenses, property offenses, other offenses against persons, disorderly/disruptive behavior offenses)
In 2016/17 Ablemarle County Schools (ACS) reported a total of 1057 of these incidents. Charlottesville City Schools (CCS) reported 185. Either ACS, with is 3x larger but has 8x the behaviors, is a lot more dangerous than CCS, the city underreports, or some combination of both. In either case, it’s hard to make a fact based assertion that city schools are somehow more dangerous than county schools.
Third, I went in search of data on CPS cases on Albemarle County and Charlottesville city. The Virginia Department of Social Services (VDSS) website has this information.
I found data from 7/1/16 through 6/30/17, where CPS found a preponderance of evidence that abuse/neglect had occurred. There were 193 such cases in Charlottesville city, 125 of which were physical neglect. There were 112 cases in Albemarle County, 56 of which were physical neglect.
VDSS tracks referral sources for these cases – there are over 45 of them. A few of the sources are most relevant for public school. Based on that, 28% of CPS referrals in Charlottesville come from the schools; in the county it’s 24.7%.
A few thoughts on this information. First, each of these numbers represents a terrible situation where things are not the way they should be.
Second, The vast majority of children in poverty are not abused or neglected, but those who are abused/neglected are likely poor. 22% of kids in Charlottesville city live in poverty and 57% of those in CCS are considered economically disadvantaged. Those numbers are 10% and 29% respectively in ACS.
Third, children who have experienced trauma are more likely to be have difficulty in schools academically, socially, and behaviorally. Some become passive; others constantly act out because their brains are constantly in fight or flight mode, with behaviors that can be extremely disruptive or potentially dangerous.
[I personally knew basically nothing about the impact of trauma in children’s lives (and brains) until 9 years ago when I met my wife’s two adopted cousins who have attachments disorders. ]
Fourth, there are a lot of resources available to these kids in our area, which are frequently used with success. However in many of these situation, it can be very difficult to get these children access to all the services they need because…they come from dysfunctional homes!
Hope this helpful.