

Revisiting the “0-5 Buyer Is Gone” Theory
We’re in a different market now. Some of the people who bought between 2021 and 2024 are trying to sell — and the ones who bought new construction, now competing against new construction, are having a hard time. Which is its own kind of evidence: the buyer who sells inside five years — the one I said was finished back in 2011 — may struggle now to sell.
One of the benefits of being a Realtor since 2001 and writing since 2005 is that I hold myself accountable in writing. You’ll see that’s a double-edged sword.
A fifteen-year check-in on a 2011 post
Back in August 2011, in the wreckage of the last housing bust, I wrote that the “0-5 buyer” — the person who buys a home and sells it inside five years — was finished. I argued the homeownership lifecycle was stretching out, first-time buyers were starting later, transactions were headed permanently lower, and that a student-debt “education bubble” was going to strangle the next generation of buyers the way the mortgage bubble had strangled the last one.
Fifteen years of data are in. I’m not going to grade myself on much of a curve. Most of that call was right. A lot of the reasoning underneath it was wrong. Here’s the honest version.
What I got right
The 0-5 buyer really is gone. In 2025, the typical seller had owned their home for a median of 11 years before selling — an all-time high (NAR, 2025 Profile of Home Buyers and Sellers). Buyers now expect to stay a median of 15 years, and 28% say they never intend to move again. In 2005, the typical owner stayed 6.5 years (Redfin, 2026). I threw out a “20-to-40-year cycle” line in 2011 as hyperbole. It turned out to be closer to the truth than I thought.
First-timers are starting later. Every dataset agrees the first-time buyer is older than they used to be. How much older is a genuine fight — NAR’s survey says a record median age of 40 – and this is a number I’ve restated often without challenging until I researched this post – while loan-record datasets from the Mortgage Bankers Association, Cotality, and the New York Fed put it closer to 32-33 and much flatter over the last decade (Scotsman Guide, 2026). The direction is settled; the size of the shift is not. I’ll take directionally right.
Charlottesville’s economy has mostly held. I said in 2011 that we had a more stable foundation than most of the country. We did. The Charlottesville metro unemployment rate was about 3% at the end of 2025 (FRED / U.S. BLS) — still one of the lowest in Virginia (I did not foresee the destruction/minimization of the BLS/Census/etc.). The names changed — Martha Jefferson became Sentara, SNL Securities got absorbed into S&P — but UVA, health care, defense, and tourism carried the load exactly as I figured.
What I got less right
The timing. Badly. I predicted the buyer pool would shrink “for the next seven to ten years.” Instead, 2012 through 2021 was one of the biggest booms in American housing history, powered by the millennials I said would sit it out. If you’d quoted my 2011 post in 2016, you’d have looked foolish.
The mechanism. I thought the trigger would be debt — specifically an education bubble crushing young buyers — student debt remains a significant drag on a lot of homebuyers. The actual trigger, when the market finally froze, was a rate shock and an affordability wall. In 2020 and 2021, millions of owners locked in mortgages below 4%. They’re giving these up — slowly. Combine that with 6% to 7% rates and prices that had only gone up, and you get a market that’s stuck, not slow: existing-home sales totaled 4.06 million in 2025, the lowest since 1995 — a 1995 sales number in a country with 75 million more people (USNews/AP, 2026). So “fewer transactions is the new normal” came true. It just came true a decade late and for reasons I didn’t name. I’m going to say that I got this right. 🙂
The student-loan “subprime crisis” never came crashing down but it’s still there. The debt itself ballooned — from the $850 billion I cited to roughly $1.8 trillion today (Education Data Initiative, 2026), and it still exceeds the nation’s credit-card balances, the crossover I flagged back then. But the cascading default crisis I warned about didn’t materialize. What we got instead was a multi-year federal payment pause, mass-forgiveness attempts that the courts struck down, and — now that repayment has resumed — delinquencies are climbing again. It’s a slow drag on household balance sheets and a permanent political football, not the second coming of 2008. Federal loans sit on the government’s books; there was never a private-market fuse for them to blow. I still think I’m right, but the proverbial can remains kicked down the road.
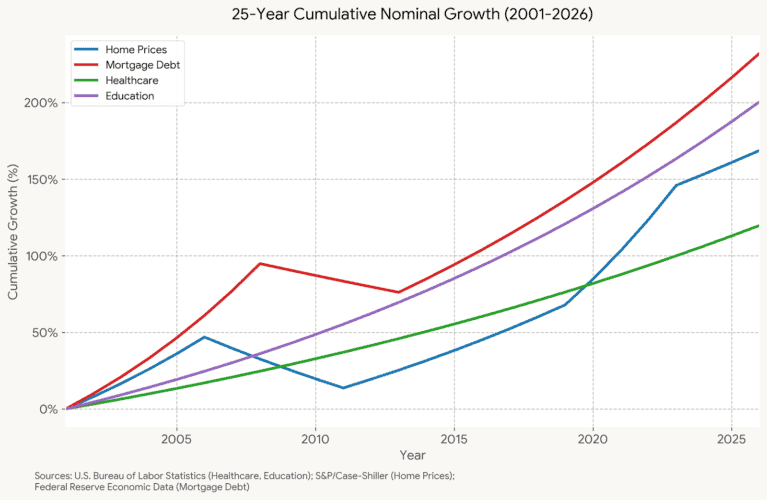
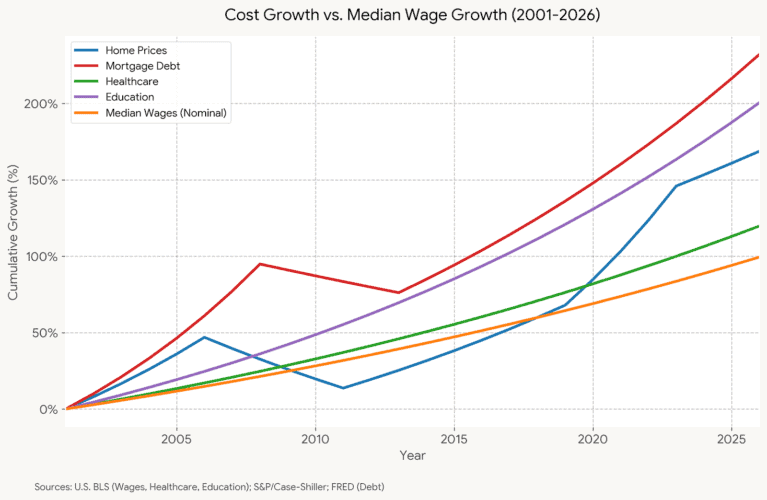
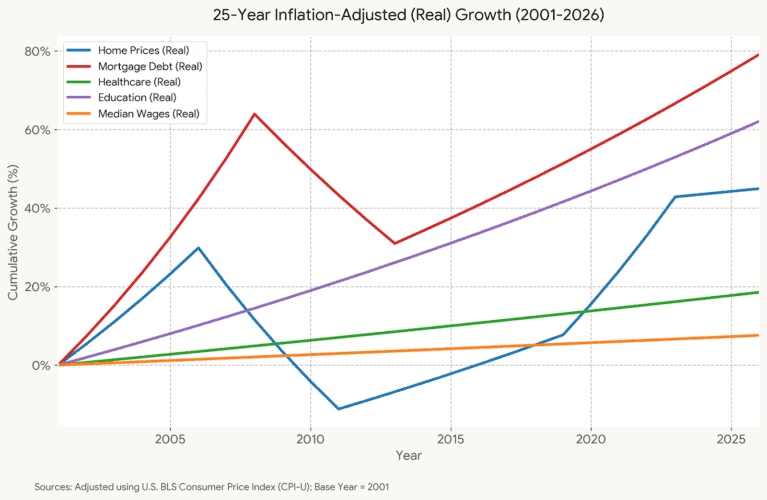
And the chart I built the whole thing on is upside down. My 2011 argument leaned on tuition being the runaway line — the education bubble inflating faster than everything, including housing. The exact opposite happened. Real net tuition growth turned negative from about 2016 on (Richmond Fed, 2024); adjusted for inflation, tuition has barely moved since 2010. Meanwhile the national median single-family home price jumped roughly 45–50% between mid-2020 and mid-2025. Tuition flattened. Housing exploded. If I redrew that chart today, the lines would have swapped places.
Two things I didn’t see coming
I ended the 2011 post with a libertarian flourish: get the government out of the way, kill the mortgage interest deduction, let the market sort it out. Fifteen years later, I still think the MID should go away. I have never had a buyer say, “I’m buying this house for the tax break.” It’s part of the equation but not a top-5 reason.
The mortgage interest deduction did get gutted — just not on purpose. The 2017 tax law nearly doubled the standard deduction, and the overall itemization rate fell from about 31% to roughly 9% (Congressional Research Service). For most homeowners, the MID is now a dead letter, and the housing market did not collapse when it happened. I more or less got the outcome I asked for, and the sky held.
The second one is sharper. The thing that finally produced my predicted frozen, low-turnover market — owners chained to their 3% mortgages — is a direct product of the ultra-low-rate, Fed-engineered era of 2020-2021. In other words, the market outcome I wanted the free market to deliver on its own was manufactured by exactly the kind of intervention I was complaining about. Rate lock-in has government fingerprints all over it.
What the “new normal” actually looks like from Charlottesville in 2026
Locally, the shape is clear. Albemarle’s median sits in the mid-$500,000s to high-$500,000s, up roughly double from 2011 (CAAR Q2/Q3 2025 reports). The full six-locality CAAR region (MSA +1 county) runs around 1,000 sales a quarter — well off the 2021 peak but not collapsed — with inventory finally rebuilding after years of scarcity — and, in late 2025, the first regionwide price dips in six years. Nationally, first-time buyers have fallen to a record-low 21% of the market, half their pre-2008 share (NAR, 2025). The market has split into two: equity-rich repeat and cash buyers on one side, priced-out first-timers on the other.
So here’s the fair grade on 2011 me: good structural instinct, wrong clock, wrong cause. I saw the lifecycle lengthening and the first-timer squeeze coming, and both arrived. It wasn’t the education bubble. It was a rate shock stacked on top of an affordability wall — with student debt riding along as one more weight in the buyer’s backpack rather than the thing that broke his back.
As I quoted a colleague back then, and still believe: the market isn’t good or bad. It is. And we work in it.
Sources: NAR 2025 Profile of Home Buyers and Sellers; U.S. Bureau of Labor Statistics / FRED; CAAR 2025 quarterly reports; Federal Reserve Bank of Richmond; Education Data Initiative; Congressional Research Service; Redfin; Mortgage Bankers Association.