With the release of the Virginia Association of Realtors’ Third Quarter Homes Sales Report, I thought it would be interesting to see how Charlottesville’s and Albemarle’s home sale data looked over the years. For total…
Posts tagged 22911
NGIC and DIA – Coming to Charlottesville – Really!
As seen on Twitter: Bryan McKenzie reports in today’s Daily Progress … Employees of the Defense Intelligence Agency will begin moving in January to the military’s Joint-Use Intelligence Analysis Facility at Rivanna Station in Albemarle…
Charlottesville Area Real Estate Market Report – 3rd Quarter 2009
As with most everything when looking the Charlottesville area real estate market, look for the trends, rather than the specific data points. The Nest Report is coming shortly as is the market report I do…
Search for Homes by Price Reduction
Yep. You can do that, too. 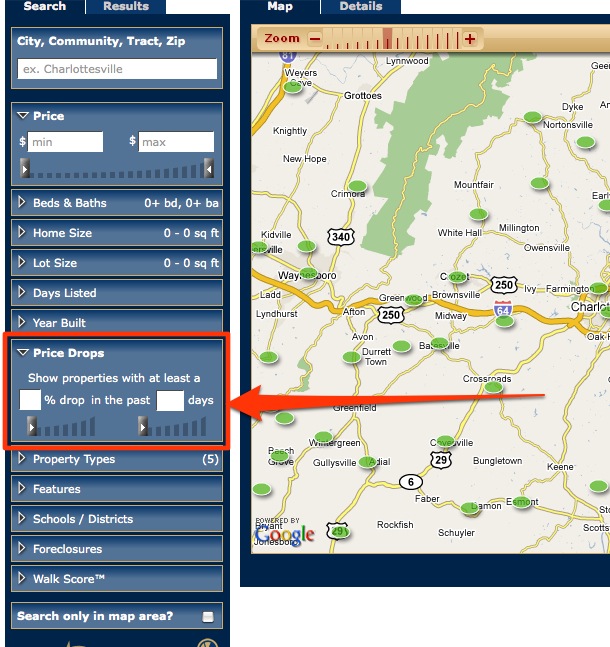 Inspired by Trulia’s recent announcement of a similar feature on Trulia .
Charlottesville Area Association of Realtors’ 1st Quarter Market Report
A balanced market should have a DOM of approximately 90, but we have not been in that range since 2006. 1st Quarter Average Days on Market County 2005 2006 2007 2008 2009 Albemarle 64 70 116 135 113 Charlottesville 72 62 75 141 167 Fluvanna 70 79 108 135 127 Greene 67 76 99 90 92 Louisa 114 119 158 110 70 Nelson 73 83 118 152 164 Orange 89 83 95 125 163 Area Average 75 80 107 132 134 Central Valley 126 143 144 *includes sales outside the counties listed **numbers courtesy of the Greater Augusta MLS New Construction Still Slow It is important to note that many “new†homes are not included in CAAR MLS statistics. … As expected, the average costs per square foot have decreased in every area covered in this report. 2005 2006 2007 2008 2009 1st Quarter Price Per Square Foot County 2005 2006 2007 2008 2009 Albemarle 155 173 174 176 155 Charlottesville 172 186 186 193 159 Fluvanna 121 141 135 137 122 Greene 133 148 157 147 134 Louisa 122 146 142 153 114 Nelson 193 232 206 197 176 Orange 133 175 195 129 110 Area Average 150 169 166 163 140 Central Valley 131 121 117 *includes sales outside the counties listed **based on CAAR MLS data Condos and Townhomes The sale of attached homes is only reported in Charlottesville and Albemarle because very few properties in this category are located in other counties, except Nelson.
What Do You Want to Know?
) Looking at the baseline in January for Charlottesville and Albemarle , we will hopefully be able to get a feel for what the Charlottesville real estate market is doing.
 Anecdotally, there are a lot of buyers in the market, but a lot of sellers are looking at being under water … we’re not yet out of the woods.