There is a tendency to watch real estate market data too closely … paralysis by analysis is all too common. Interest rates, mortgage applications, foreclosures … there is so much to watch, evaluate, interpret and analyze. Some of the data and analysis are useful, some are superfluous.
Keep in mind that below we’re looking at the moving median price for the entire Charlottesville MLS – inclusive of the Charlottesville MSA (Charlottesville, Albemarle, Fluvanna, Greene, Nelson) as well as outlying areas such as Madison, Waynesboro, Rockbridge, etc. With that disclaimer, note that we’re looking at wider market trends – as in – is the median price increasing? Or are we preparing for a double dip? Or are we in the midst or nearing the bottom of the market? It’s too early to say yes or no …
We’re all – even those of us who do this every single day – looking for the benefit of hindsight.
For a later post, I’ll break these down by property type – condo, attached, single family, locale, etc. But … it seems that the median price has been increasing after the expiration of the homebuyer tax credit.
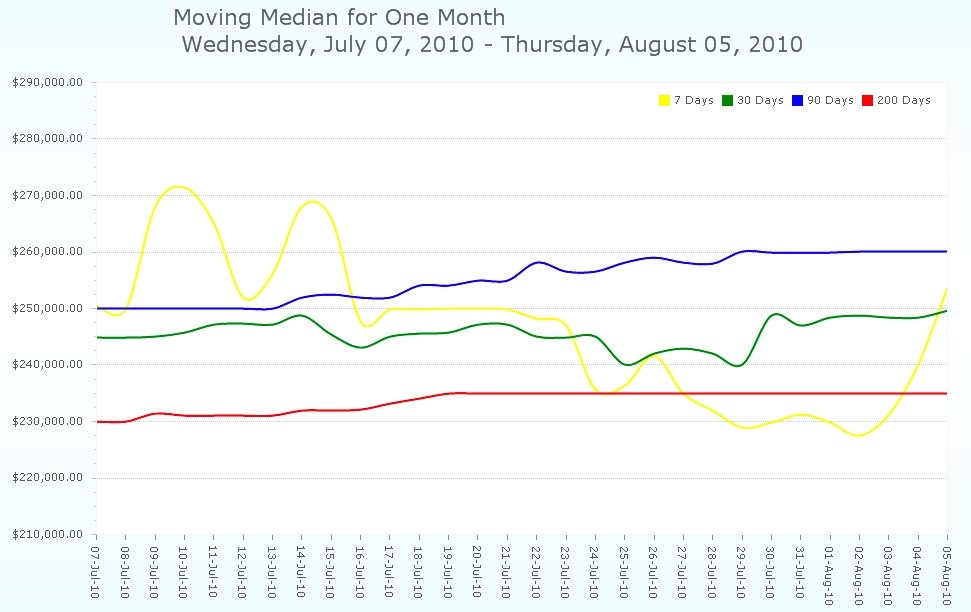
Looking at the moving median price for the past year …

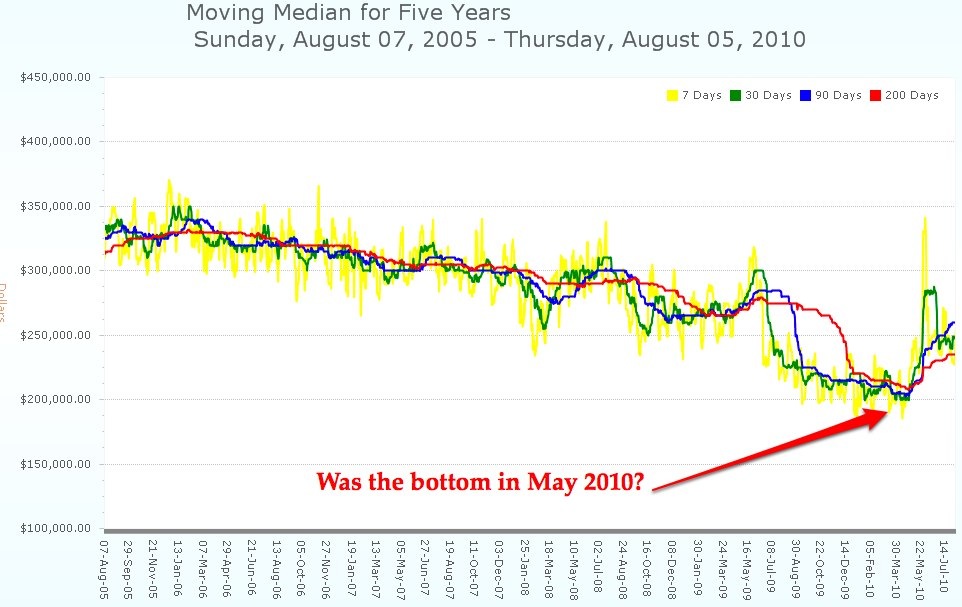
And for the past five years … I wish this chart allowed for more than five years, but stay tuned, we have some interesting things in the works at Nest.
See all posts in the Friday Charts series.
And, because when I start looking at market data and charts, I can rarely stop with one … my mind starts wondering and wandering and asking questions …
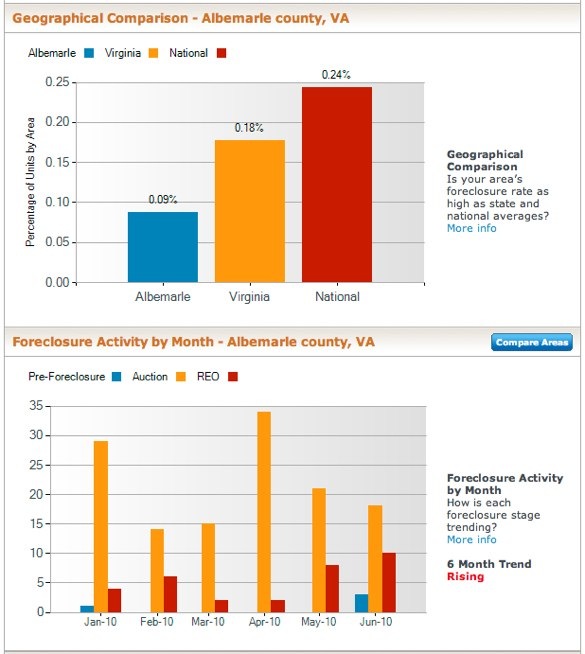
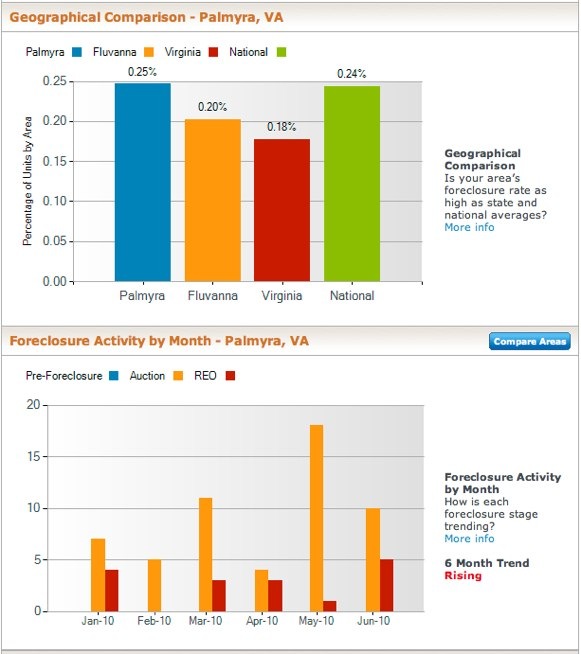
As an aside – what’s happening in the Charlottesville foreclosure market? Foreclosure charts courtesy of RealtyTrac:
For Albemarle County:
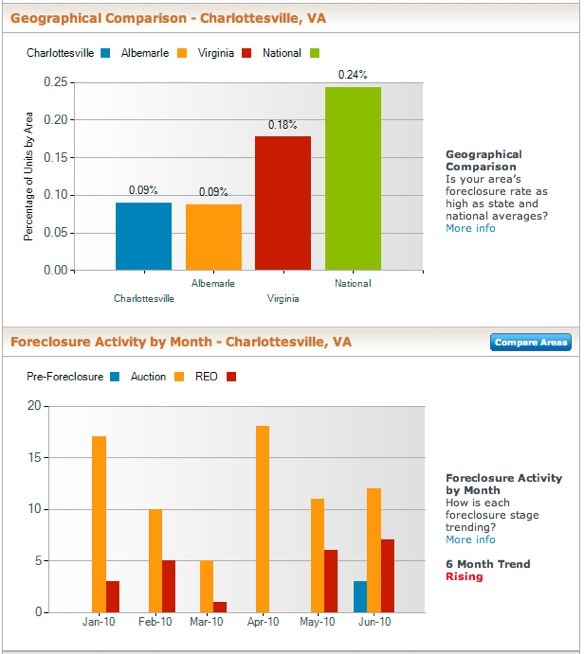
For the City of Charlottesville:
For Palmyra in Fluvanna County, which includes Lake Monticello: (they have more foreclosures per capita than Charlottesville or Albemarle)
Of course, God only knows what our government might do … all of our analysis would be for naught.
See all posts in the Friday Charts series.