“Last month the CAAR had about 2,900 homes on the market, only 95 of them sold.”
When I saw that number, my first thought was “What? That’s awful. I need to double check that.”
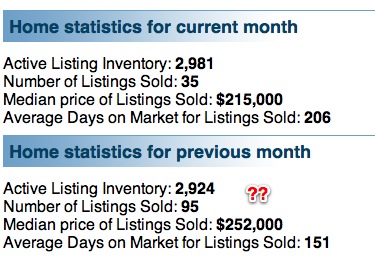
Try as I might, I couldn’t replicate these numbers, so I asked CAAR for clarification; as soon as I receive that I will post it here.
CARR staff really are extremely helpful and responsive. The answer I received was very technical, with words such as query, local table name and other such cryptic terms. 🙂 The short answer is: For February, it isn’t 95 homes sold, it’s 138.
Succinctly, Year over Year, for the first 71 days of the year:
– # of homes that have been listed: down 6.5% (good news)

 – # of homes put under contract: up 7%

– # of homes sold: down 15%
Further, for starters, how do they define “CAAR”?
– Is it “Charlottesville/Albemarle”? Charlottesville MSA? All of the MLS (about 30+ counties)?
– In Charlottesville/Albemarle in February 2011, 66 homes sold.
– In Charlottesville, Albemarle, Fluvanna, Greene, Nelson, 106 homes sold.
– In Charlottesville, Albemarle, Fluvanna, Greene, Nelson, Louisa, 133 homes sold and 172 went under contract.
– In the entire MLS, (which is mostly irrelevant to my readers) 455 homes sold.
For a better representation of real estate data that is relevant to real estate buyers, sellers, voyeurs, consumers in the Charlottesville MSA:

Same information, different display:
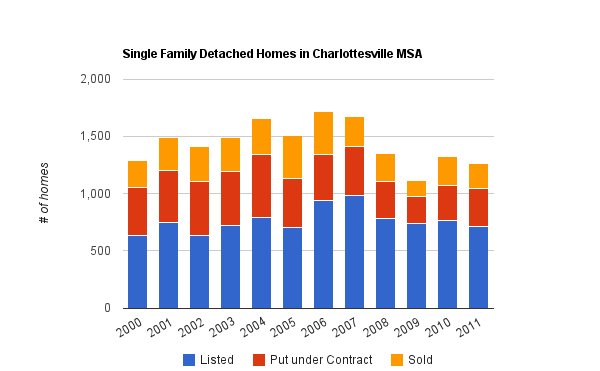
(I like this one as it gives a good understanding of the total volume we’re dealing with)
As always, raw data is at the bottom of this post.
I don’t envy local reporters; they are given limited time and resources to report on a complex subject. Boiling the real estate market to a 90 second clip inevitably will lead to missing information. The reason the 95 sold didn’t sound right or reasonable to me is because I do this every day.
For the sake of accuracy, I typically discount/ignore aggregate days on market; they are so easily manipulated (such as by those entering new construction with 0 days on market to make their numbers look better, realtors gaming the mls, etc)
– Even More about Days on Market
– Days on Market Matter in Charlottesville
– For consistency, I am excluding Louisa County. They are still not officially part of the Charlottesville MSA, and were not included in the market until the last five years or so.
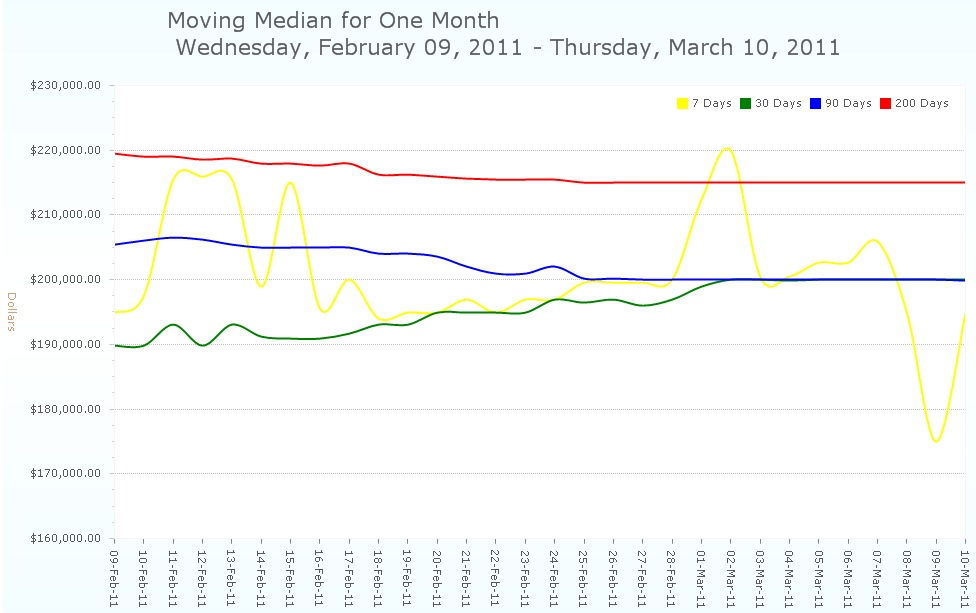
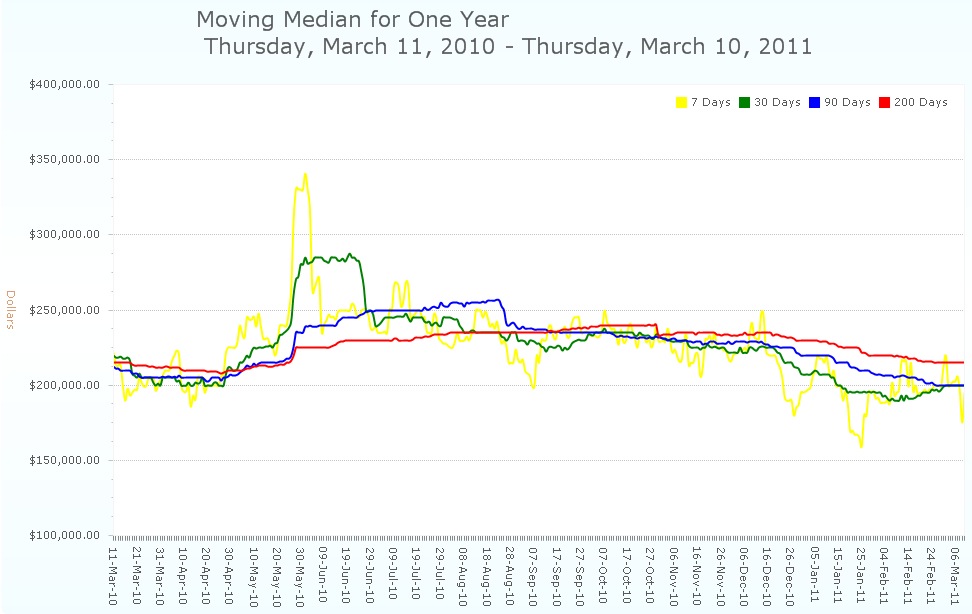
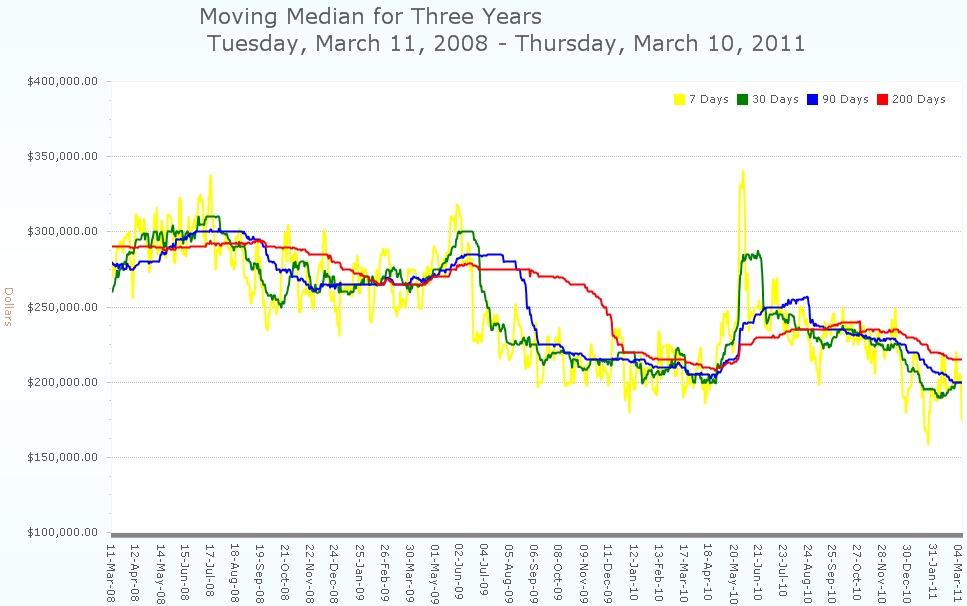
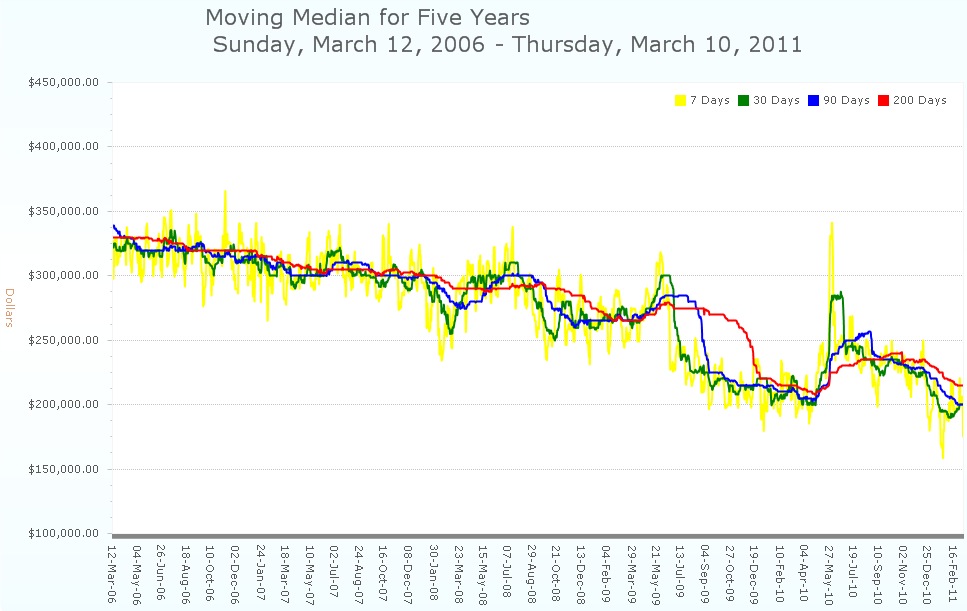
Moving median home prices for the entire Charlottesville MLS for one month, one year, three years and five years. Focus on the trend lines rather than the numbers. Looking at this broad of a dataset is not useful when considering what your home may be worth.
Raw data, inclusive of inadequate short sales and foreclosures:
.See all Friday Charts in the series.
Pingback: It’s Not about the NAR’s Numbers, It’s about the NAR’s Credibility | | RealCentralVA.comRealCentralVA.com