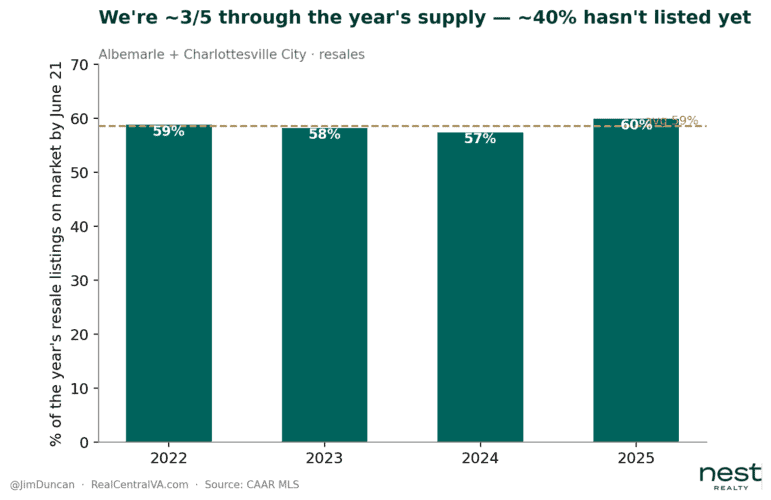
If 2026’s Charlottesville real estate market is anything like last year’s market, we still have a ways to go — ~40% of this year’s listings haven’t come on the market yet.
I was going to wait until first week of July to write this so we’d have end of month data, but I suspect (I could be wrong) we won’t see any real shocks or surprises when we see final numbers at the end of June/start of July. The data and thoughts below are directionally accurate, and reflect what I am seeing in the Charlottesville market right now.
What matters to my clients are the actionable and specific analyses for them as that’s data that matters for decision-making, rather than broader sentiment analysis like this. That said, I love data, and enjoy sharing the numbers with you.
Waiting until the end of the month might reasonable, and also somewhat arbitrary; I have never had a client who has waited six days to make a decision so that they have end of month data. 🙂
A few things right now:
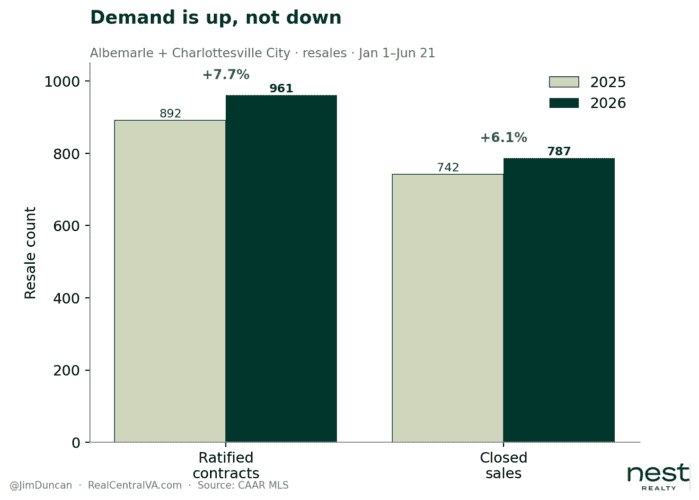
Scope/method: Albemarle + Charlottesville City, resales only, 1/1–6/21 each year. Contracts counted by Ratified Contract Date sales by Closed Date; days-to-contract = List Date ? Ratified Date
| Metric | 2025 | 2026 | Move |
|---|---|---|---|
| Ratified contracts | 892 | 961 | +7.7% |
| Closed sales | 742 | 787 | +6.1% |
| Typical days-to-contract (sold) | 11 | 13 | slower |
| Median SP/LP (sold) | 100.0% | 99.8% | slips below ask |
| Median sold price | $543,000 | $543,000 | flat to the dollar |
| Contracts ?14 days (share of all contracts) | 58% | 51% | down ~7 pts |
Demand isn’t necessarily softening — it’s up a bit; and there is more inventory than we have seen in a while.
Through June 21 this year, 961 resale homes in Albemarle and the City went under contract. Same stretch last year? 892. That’s roughly 8% more buyers getting to “ratified,” not fewer. If you’ve been reading national headlines about a cooling market and wondering whether Charlottesville is following, the contract activity says the opposite — people are still buying, and more of them are under contract right now than were a year ago.
And if you are a seller who’s frustrated, I get it. I do this every day, and the headlines can be misleading and frustrating if you’re seeing something different.
Closings tell the same story, with one wrinkle. 787 resales have sold so far this year against 742 last year — again, more, not fewer. The wrinkle is speed. The typical home took 13 days to go under contract this year, up from 11 last year. Two days isn’t a crash; it’s a market catching its breath. And sellers are still getting their number — the typical home sold at 99.8% of list, essentially full ask, and the typical sale price held at $543,000, flat to the dollar against last year. More homes selling, a touch slower, at basically list, with prices holding. That’s not a market falling. That’s a market normalizing.
One of the numbers I’m watching. Last year, 58% of the homes that went under contract did it in 14 days or less. This year, it’s 51%. More than half still go in two weeks — but the share moving that fast has shrunk. This is the bifurcation I keep coming back to: price it right and it still flies, price it on hope and it sits.
Another number I’m keeping my eye on – de-listings (see below)
I wrote in December 2025
(A brief pat on my own back for calling these, as these are the four big things this year)
Four Things I’m watching now and in 2026
- De-listings, and anticipating re-listings. We’re seeing more de-listings than I recall ever seeing. 125 withdrawn this year so far. There were 17 last year. Is this a great way to evaluate this segment? I think it’s good enough. If 100 of those 125 come on the market next year, they will meaningfully affect the market, especially if they come on at lower prices.
- Price reductions and patience. How motivated might the sellers be? How patient will buyers be now that they have choices and options?
- Contracts and days on market. Did you know there’s a movement among a big national brokerage or two to remove public display of days on market? Yeah, insane. How fast do homes go under contract? And how many price reductions are necessary?
- New listings: When did they purchase and for how much? This is a big one. For the people whose only experience in residential real estate is setting the price based on what they want/need to make, a market based more on data is a huge shift. Think about it: if you bought in 2017, sold in 2023 and made a big profit and bought another house, and life happens in 2026, you might not be able to sell without losing money. That’s a monumental change, which may lead to lower inventory because these sellers may choose to stay or rent. (What are the sellers’ expectations likely to be?)
Price Bands & De-Listings
Where (and how fast) homes are selling by price
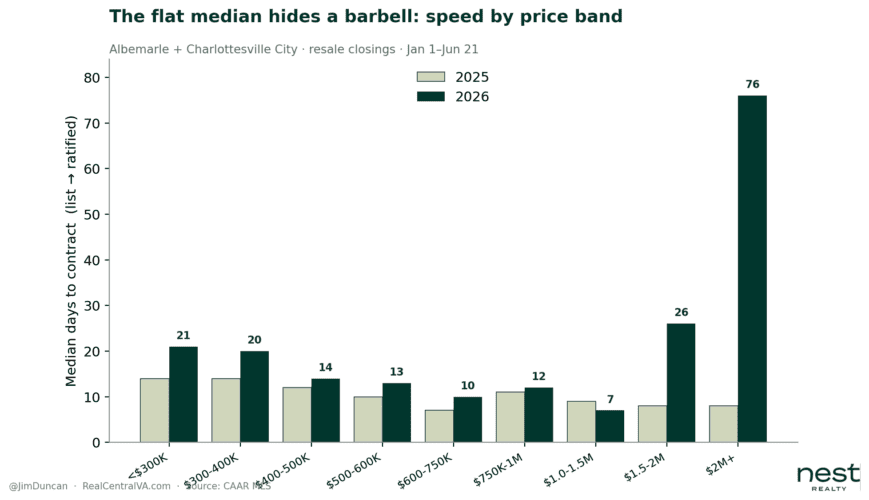
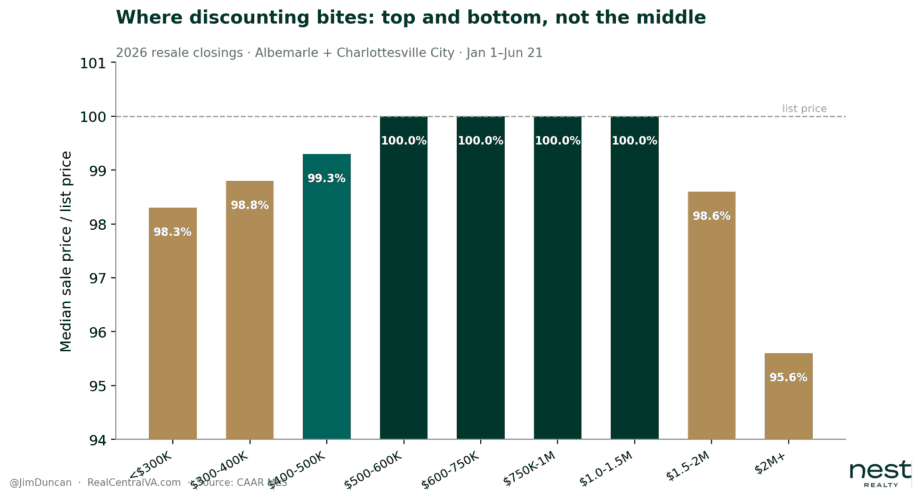
The lead finding: the flat $543K median hides a barbell. Middle firm, ends soft.
What matters is your micro-market, whatever that is.
| Band | 2026 sales | % | DOM ’25?’26 | SP/LP ’26 |
|---|---|---|---|---|
| <$300K | 81 | 10% | 14 ? 21 | 98.3% |
| $300–400K | 124 | 16% | 14 ? 20 | 98.8% |
| $400–500K | 132 | 17% | 12 ? 14 | 99.3% |
| $500–600K | 112 | 14% | 10 ? 13 | 100.0% |
| $600–750K | 124 | 16% | 7 ? 10 | 100.0% |
| $750K–1M | 92 | 12% | 11 ? 12 | 100.0% |
| $1.0–1.5M | 69 | 9% | 9 ? 7 | 100.0% |
| $1.5–2M | 32 | 4% | 8 ? 26 | 98.6% |
| $2M+ | 21 | 3% | 8 ? 76 | 95.6% |
Note: $1.5M+ rows are small-n (32, 21). The 76-day figure is real but volatile — we’ll call that a “small sample.” Also note: This is where “prices holding” breaks. True for the middle, false at the top ($2M+ at 95.6% of list). It’s a caveat.
The bifurcation isn’t just priced-right vs priced-wrong; it’s also which price band you’re in.
DE-LISTINGS — with a note
De-listings remain a number I’m watching. In 2024, ~17 homes were withdrawn. In 2025, about 125 — by the count I ran in real time, before relistings overwrote the record. This year is on a similar elevated track: roughly 80 withdrawn by late June, and climbing. I can’t hand you a clean year-over-year multiple, because withdrawn homes that relist or sell get their status overwritten — any single pull undercounts the past and overstates the present. But the direction isn’t in doubt: far more sellers are pulling homes than the historical norm. They list, the market doesn’t meet their number, and they choose to stay or rent. Watch for them to come back — and watch what they ask when they do.
Pulling this data on the evening of 25 June:
- In Charlottesville and Albemarle in 2025, there were 16 listings that were withdrawn.
- So far this year, there have been 79 withdrawn.
The numbers above are statistically malleable and directionally accurate. More sellers are putting their homes on the market, the market is not meeting their expectations, and they are choosing to either stay, or rent.
The market is what it is.
None of this tells you what your house is worth, or what you should offer on the one you want. The median is a story about the market — it isn’t a story about you – your price band or your situation. That’s the analysis worth having: the specific kind, run for your address instead of two counties. If you’re thinking about buying or selling in the next year and you want the real number for where you actually sit — not the headline — call or email me. We’ll run the numbers and see what we can do.