Take your lede (no longer available):
– Home sales in 2010 are up 14% in Charlottesville and Albemarle year over year.
– Home sales in 2010 are up 19% in Charlottesville MSA year over year.
– Foreclosures continue to climb in Charlottesville and Albemarle.
– Questions abound regarding second half of 2010; where will we find the bottom of the market?
– If you have questions about or would like more detailed analysis, please contact me. Jim Duncan. Charlottesville Realtor.
Core Logic, Harvard, Case-Shiller and FHFA are four of the most-referenced and respected housing price indices in the country; they all have something in common – their reports are mostly irrelevant when looking at the state of the Charlottesville real estate market.
Why do any of these reports matter? Locally, they do and they don’t. Makes sense, right?
They matter because they reflect national housing and economic data and trends and impact consumer – including Realtors, builders, buyers, sellers, etc. – psychology. If buyers perceive the market to be better, they’re going to feel more confident in their buying decisions. Many sellers now are vexed by rational fear – they’re not going to be able to sell their house for what they need/want/have to make; this too is irrelevant to market value.
In short, price your home to sell. Simple (though notsoumuch in reality)
What I’m reading:
– Harvard’s State of the Nation’s Housing Market (PDF) and listening to an excellent podcast with Nicholas Retsinas (no longer available), Director, Harvard University’s Joint Center for Housing Studies (no longer available). (did you know that there was an exhibit at the Smithsonian on McMansions (no longer available)?)
– Core Logic’s Home Price Index Report for April 2010 (archived: 2021) – Virginia’s Housing Price Index, for single family homes year-over-year, is up 6.5%; for single family homes excluding distressed properties, is up 3.6%. Virginia is one of the five best states for year-over-year price appreciation excluding distressed sales .. but mostly that’s irrelevant in my opinion as the bulk of those sales are most likely comprised of Northern Virginia sales.
– The Federal Housing Finance Agency’s House Price Index for First Quarter 2010
The FHFA (formerly OFHEO) say that in the Charlottesville MSA house prices have dropped 6.98% year over year, 1.86& in the 1st Quarter 2010, and have appreciated 12.68% over the past 5 years.
For Virginia, we rank #22 in the nation – year over year, house purchase prices are down 2.03%, for the quarter, they’re down 2.84%, over five years, house prices are up 2.11% and since 1st Quarter 1991, prices are up 113.96%.
– The Obama Administration’s HUD Scorecard (archived: 2012) (PDF) Note: what’s a “martgage”? (Is a white house literacy program needed – or at least a proof-reading Czar (archived: 2018)?)
– The NAR says sales are up (archived: 2012).
– NPR points out “Three Signs Housing’s Getting Weaker”
– Case-Shiller says: (not even a hint about the Charlottesville-Albemarle real estate market)
The chart above shows the index levels for the U.S. National Home Price Index, as well as its annual returns. As of the first quarter of 2010, average home prices across the United States are at similar levels to what they were in the spring of 2003. The 2010 first quarter values fell compared to the 4th quarter of 2009; however, the annual rate of return has significantly improved entering positive territory after more than three years. From its recent 2009 Q1 trough, home prices grew nationally by 6.5% over the 2nd and 3rd quarter of 2009. From there, the 4th quarter of 2009 and the 1st quarter of 2010 saw a combined pull back of 4.2%.
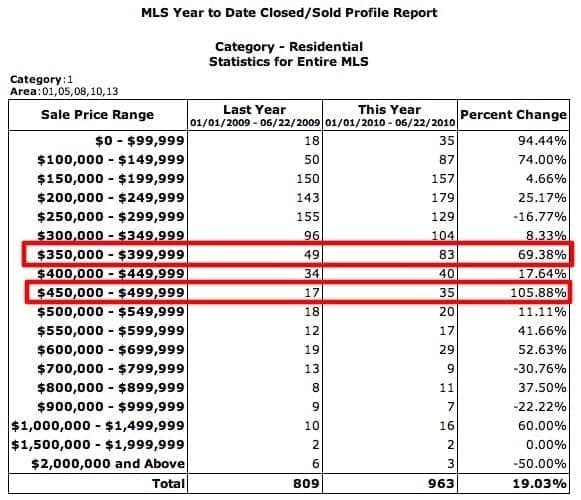
Home Sales are Up 19% year over year in the Charlottesville MSA:
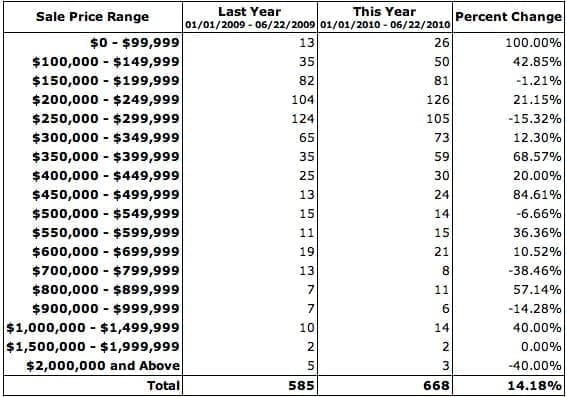
Homes sales are UP 14% in Charlottesville and Albemarle:
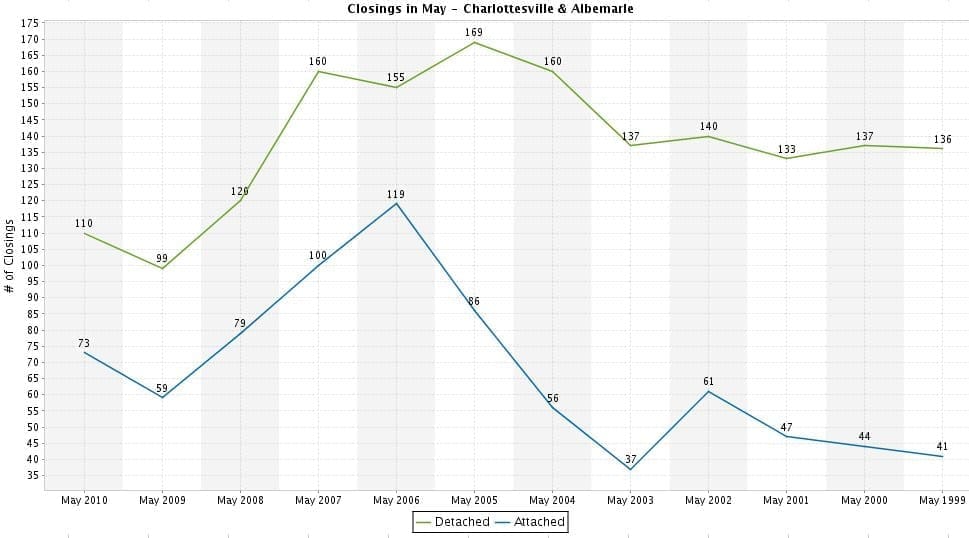
You can see the raw data for the above chart at my posterous site (archived: 2021).
One point: Charlottesville’s Unemployment is lower than the national average.
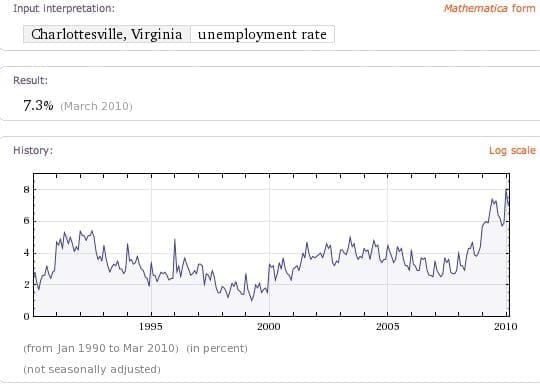
Prime example of the irrelevance of national, aggregate housing data, which is good only for political talking points and respective agendas:
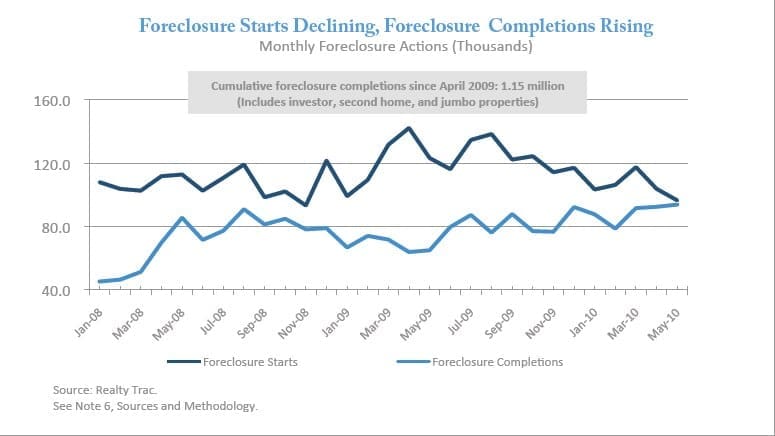
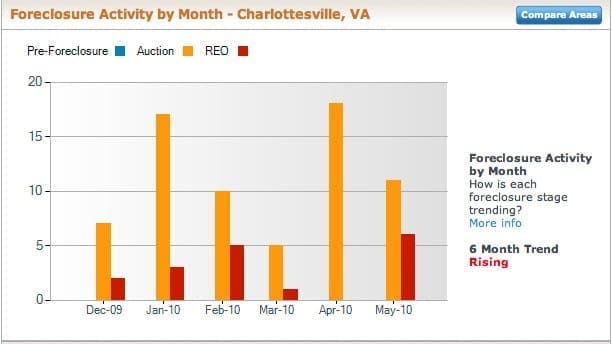
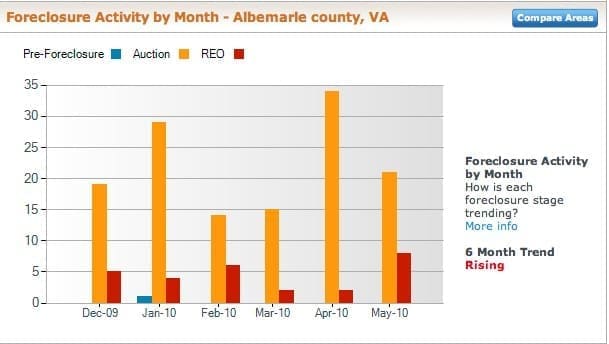
Foreclosure starts for the nation and Charlottesville and Albemarle:
National foreclosure data, courtesy of the HUD Scorecard, using RealtyTrac data:
For Charlottesville, using RealtyTrac:
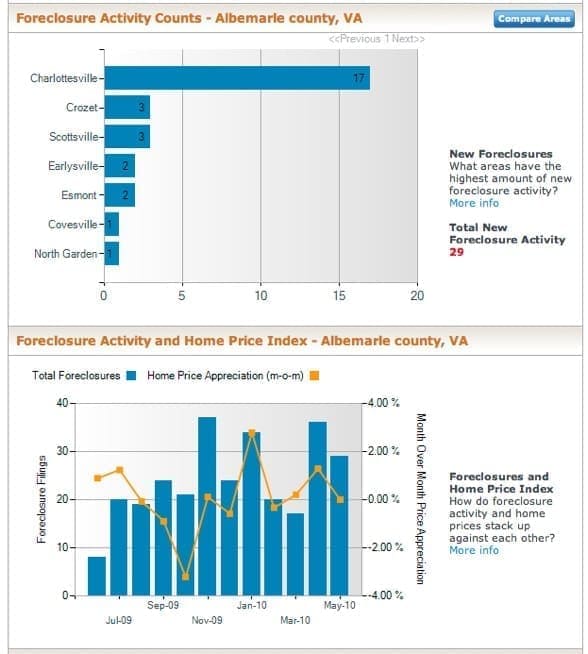
For Albemarle County, using RealtyTrac:
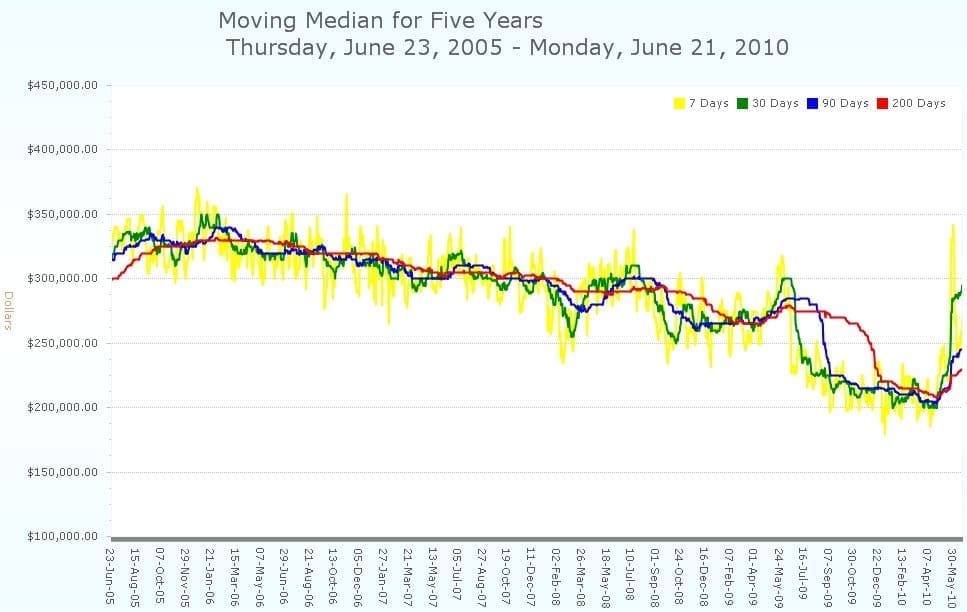
What have median home prices done in Charlottesville over the past five years?
(Click for larger image)
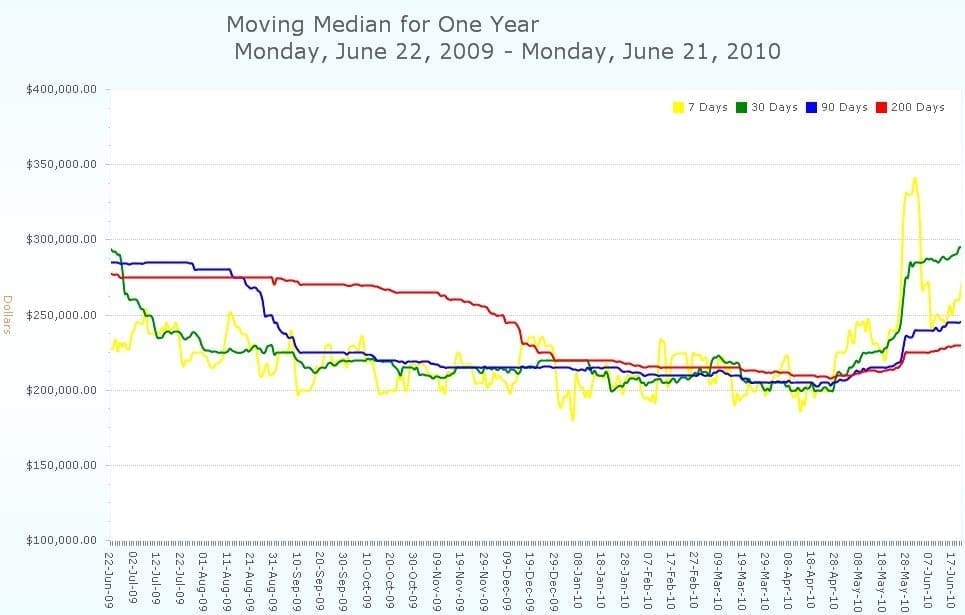
What have median home prices done in Charlottesville over the past year?
(Click for larger image)
Update 30 June 2010: In response to some questions on the Charlottesville Bubble Blog about this post, I posted an explanation on why I think national housing data are mostly irrelevant with respect to the Charlottesville real estate market:
AliG –
Thanks for the question (and I apologize to BB for hijacking the comments).
Thank you first for the kind words.
Here was my thinking in writing that post – Charlottesville’s market isn’t great, but it’s not as bad as the hotspots. We’re not Detroit, Phoenix, Florida or California. We’re not NoVa or Jersey.
The national news influences the psychology of buyers and sellers, and while that’s certainly a component and factor to our local market, it should not define the local real estate market conversation.
Our unemployment rates are lower than the national average. People still want to move to the Charlottesville area.
The various local markets all influence the national numbers, and I wanted to do what I’ve tried to do for years – add local context to the national numbers.
For instance – CNBC this morning said that of the mortgages written last month, 30% were on foreclosures. Great number, but irrelevant to Charlottesville – I’m guessing, but I’d bet that less than 10% of mortgages written last month in our MSA were on foreclosures. I could be wrong, but I don’t think I’d be that far off base.
Back to the post – there’s a reason that I posted links to so many of the national data – particularly the OFHEO pdf, which has historical data – I want people to read and educate themselves.
Case-Shiller data are irrelevant to our market; they just don’t cover our market. Thus, my statement that they are irrelevant.
I’m going to post this comment as an update to my post. I don’t want to further commandeer BB. 🙂
If you have any questions about any of the data or my speculations, I’m always happy to talk. [email protected]

Interested in Learning More?
I have been been representing buyers and sellers in Charlottesville, Albemarle, and Central Virginia since 2001. Get local insight born of experience.
Dig Deeper
Talking Real Estate Matters – Interest Rates and Midterm Elections
I was on Michael Guthrie’s radio show, Real Estate Matters, last week. As I’ve started doing, I had Granola (AI note app) running, so I could focus on the conversation instead of going back and listening to take notes. I find great value in conversations…

Charlottesville-Albemarle Real Estate Market Shifting – October 2026
This is a different blog post than usual as it's a recounting of a recent conversation with a client, supplemented by market data. A client called me this week and asked, "What's going on in the Charlottesville - Albemarle market?" If you have questions about…

How’s the Charlottesville Market? In August 2026
How’s the Charlottesville market in mid-August 2026? I ran into a client the other day I’d not seen since they bought and sold their homes seven years ago. They’re a bit removed from it, the way most people are when they’re not actively buying or…
Recapping July’s Charlottesville Real Estate Reddit AMA
Doing these AMAs is a highlight of every quarter. I learn something every time, get great questions, and hopefully help answer questions and educate people. Plus, doing these forces me to research and vet the information every time. I am sure I make mistakes, but…