And the surrounding regions …
1927 2411***. The number of properties currently on the market right now.
317. The number of properties that have sold through the MLS in Central Virginia.
36. The number of these properties that are marked as having been foreclosures.
529. The number of properties that went under contract in the first quarter.
The first quarter is over; thank goodness.
In conjunction with the Charlottesville Area Association of Realtors’ 1st Quarter Market Report, we should have a pretty good understanding of what is happening in the Charlottesville area real estate market. I have a feeling this week is going to be very heavy on discussions about “where we are” in this recessionary cycle.
As always, please let me know in the comments what further information or analysis you would like to see.
I stand by my statement in February – “Buyer activity in the Charlottesville market is picking up. Possibly way up.”
This isn’t a “rah rah” statement or an attempt to put a shine on what is a pretty dismal real estate market, but it is an attempt to demonstrate that buyers are buying and sellers are selling. Well-priced properties are seeing multiple offers (escalation clauses are poking their heads out of the history books). Realistically, it may really be a great time to buy a house – but it’s absolutely not “a great time to buy” for anybody and everybody.
Anecdotally – and statistically – houses are absolutely selling – several of the “good” properties I have seen come on the market recently have gone under contract in under 30 days. By “good” I mean – in good condition, location and price.
I know I sound like a broken record but I’ll say it anyway. If you’re buying, do your due diligence – what the seller paid for the house is irrelevant. If you’re selling, do the same – what you need to make is irrelevant. Sold comps are less valuable than active and under contract comps.
I am still baffled by the fact that, as a former English major, data has become such an intensive part of my career.
![]()
![]()
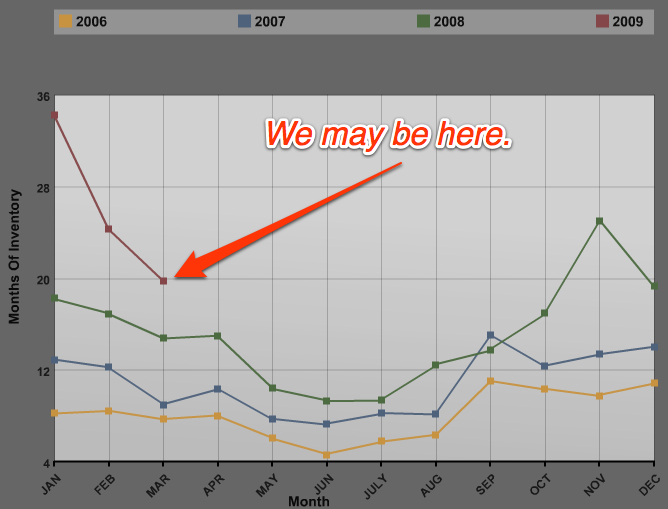
Pay less attention to the actual “months of inventory” and more to the trend lines. To see where we started the year, see the baseline post from January.
Days on Market:
Of the 1927 residential properties on the market in Central Virginia:
– 584 have continuous days on market (CDOM) of less than 30 days.
– 890 have CDOM of less than 60
– 1126 have CDOM of less than 90
– 1143 have CDOM of at least 180 days
– 458 have CDOM of at least 365 days
– 78 have CDOM of at least 730 days (I’m posting this just because I was curious, so I thought you might be, too)
Answering Joe’s question from my request for “what do you want to know” (thanks to the CAAR report):-
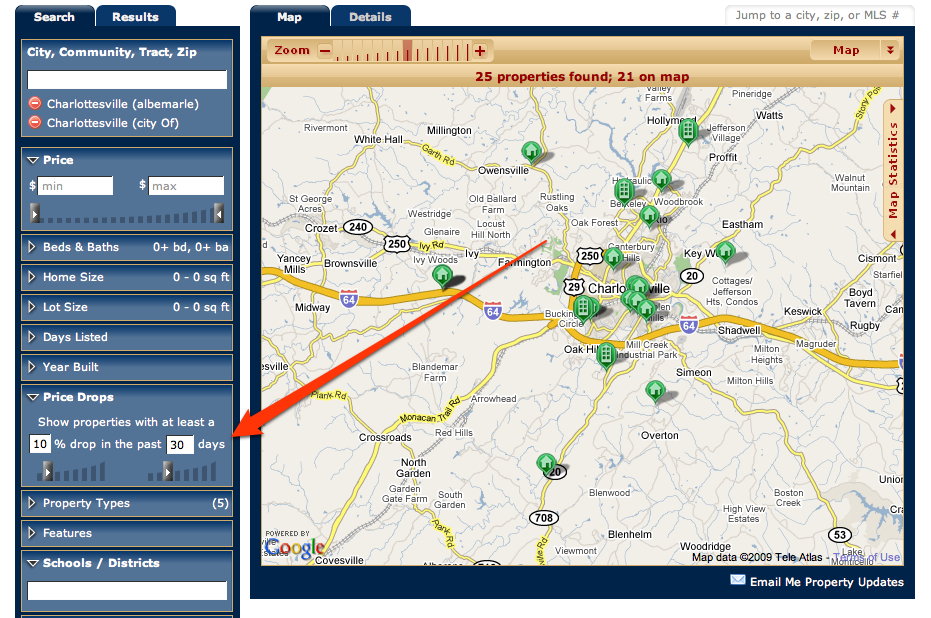
Regarding price reductions – I’m working on a way to display the sold data, but in the meantime, know this – properties that have significant (meaning at least 10%) seem to be going to contract fairly quickly. You can search for homes by price reduction (and get updated via email or RSS):
Breakdown by price range for properties in the Central Virginia region.
Breakdown by price range for properties in Charlottesville and Albemarle.
Borrowing from Greg’s comment on the Bubble Blog:
In Albemarle all categories: 1st QTR 2008 261 Contracts (33% under $300k) 1st QTR 2009 249 Contracts (74% under $300k)
In Cville all categories:
1st QTR 2008 145 Contracts
(54% under $300k)
1st QTR 2009 87 Contracts
(71% under $300k)In ALB/CVILLE/FLU/GRN
1st QTR 2008 554 Contracts
(54% under $300k)
1st QTR 2009 452 Contracts
(71% under $300k)I’m no rocket scientist but I think this means when we come back and look at the CAAR report again end of 2nd QTR, median prices are going to move some more.
This is exactly what I am seeing in the market.
Caveats:
1 – Central Virginia, for the purposes of this report, is Charlottesville, Albemarle, Greene, Fluvanna, Louisa and Nelson
2 – This is a smaller number – likely significantly smaller – than the actual number of foreclosures in our market.
3 – There is no reliable way to determine the number of short sales in our market, as there is not yet a consistent and reliable method to track foreclosures.
4 – For the purposes of this report, I am tracking the dates of 1 January 2009 to 31 March 2009. I waited until 12 April to run the numbers for two reasons – I didn’t want to duplicate the efforts of the CAAR report (efficiency you know) and often, sales don’t get closed in the MLS for several days after the end of the month.
5 – I’m limiting much of what I publish to solely the City of Charlottesville and County of Albemarle.
6 – For “macro” micro reports such as this, I just don’t trust the Days on Market anymore – the high-level numbers provide a decent guide, but for a true analysis
7 – As I have said before, “Every real estate market is decidedly local – town by town, neighborhood by neighborhood even street by street – and each property requires a specific market analysis to accurately determine possible fair market value.”
8 – Note: The “Current Inventory” column(s) reflect the number of active and contingent (on market) listings on the 16th day of each month. The “Months Inventory” column(s) value(s) equal “Current Inventory” divided by “Monthly Sales”. This reflects how many months it would take to sell out of inventory at the current months rate of sale.
9 – The source of all data is the Charlottesville Area Association of Realtors‘ MLS.
*** Updated on 14 April to correct some sort of data anomaly – I don’t know what happened when I ran the numbers, but somehow I ran the numbers incorrectly.
Pingback: Charlottesville Virginia Real Estate » First Quarter Real Estate Breakdown
Jim, is the discrepancy in your 1927 properties ‘on the market’ vs. the 3,600+ on the CAAR site the exclusion of Orange and Central Valley? So, by extension, if you are reporting 317 sold to CAAR’s 403, and 1927 to their 3608 properties, that would mean that there are 1681 properties in those two areas and only 86 sales?
Pingback: Jim Duncan on WINA radio discussing Charlottesville and Central Virginia real estate market | Real Central VA
Pingback: Nearly Mid-2009 Market Report for Charlottesville and Albemarle | Real Central VA
Pingback: Nearly Mid-2009 Market Report for Charlottesville and Albemarle real estate market | Real Central VA
Pingback: Charlottesville MSA Real Estate Market Update – August 2011 – How This Matters to You | RealCentralVA.com